15 Joint and conditional probabilities
P(A) = 0.3, P(B) = 0.7
- Can you compute P(A and B) if you only know P(A) and P(B)? Answer
No, but we could if A and B are independent.
- Assuming that events A and B arise from independent random processes, LIST ISSUE what is P(A and B)? Answer 1 what is P(A or B)? Answer 2
\(0.3+0.7-0.21=0.79\text{.}\)
Same as \(P(A)\text{:}\) 0.3.
- If we are given that P(A and B) = 0.1, are the random variables giving rise to events A and B independent? Answer
No, because 0.1 \(\ne\) 0.21, where 0.21 was the value computed under independence from part (a).
- If we are given that P(A and B) = 0.1, what is P(A\(|\)B)? Answer
\(P(\)A\(|\)B\() = 0.1 / 0.7 = 0.143\text{.}\)
16 PB & J
Suppose 80% of people like peanut butter, 89% like jelly, and 78% like both. Given that a randomly sampled person likes peanut butter, what's the probability that he also likes jelly?
17 Global warming
A 2010 Pew Research poll asked 1,306 Americans “From what you've read and heard, is there solid evidence that the average temperature on earth has been getting warmer over the past few decades, or not?”. The table below shows the distribution of responses by party and ideology, where the counts have been replaced with relative frequencies. 6
|
Response |
|
|
Earth is |
Not |
Don't Know |
|
| Party and ideology |
warming |
warming |
Refuse |
Total |
| Conservative Republican |
0.11 |
0.20 |
0.02 |
0.33 |
| Mod/Lib Republican |
0.06 |
0.06 |
0.01 |
0.13 |
| Mod/Cons Democrat |
0.25 |
0.07 |
0.02 |
0.34 |
| Liberal Democrat |
0.18 |
0.01 |
0.01 |
0.20 |
| Total |
0.60 |
0.34 |
0.06 |
1.00 |
- Are being the earth is warming and being a liberal Democrat mutually exclusive? Answer
No, these events are not mutually exclusive, there are people who believe the earth is warming and are liberal Democrats.
- What is the probability that a randomly chosen respondent believes the earth is warming or is a liberal Democrat? Answer
\(0.60 + 0.20 - 0.18 = 0.62\text{.}\)
- What is the probability that a randomly chosen respondent believes the earth is warming given that he is a liberal Democrat? Answer
\(0.18/0.20 = 0.90\text{.}\)
- What is the probability that a randomly chosen respondent believes the earth is warming given that he is a conservative Republican? Answer
\(0.11/0.33 \approx 0.33\text{.}\)
- Does it appear that whether or not a respondent believes the earth is warming is independent of their party and ideology? Explain your reasoning. Answer
No, otherwise the final answers of parts (b) and (c) would have been equal
- What is the probability that a randomly chosen respondent is a moderate/liberal Republican given that he does not believe that the earth is warming? Answer
\(0.06/0.34 \approx 0.18\text{.}\)
18 Health and health coverage, Part II
Health coverage part I Introduced a contingency table summarizing the relationship between health status and health coverage for a sample of 20,000 Americans. In the table below, the counts have been replaced by relative frequencies (probability estimates).
|
Health Status |
|
| Health coverage |
Excellent |
Very good |
Good |
Fair |
Poor |
Total |
| No |
0.0230 |
0.0364 |
0.0427 |
0.0192 |
0.0050 |
0.1262 |
| Yes |
0.2099 |
0.3123 |
0.2410 |
0.0817 |
0.0289 |
0.8738 |
| Total |
0.2329 |
0.3486 |
0.2838 |
0.1009 |
0.0338 |
1.0000 |
Are being in excellent health and having health coverage mutually exclusive?
What is the probability that a randomly chosen individual has excellent health?
What is the probability that a randomly chosen individual has excellent health given that he has health coverage?
What is the probability that a randomly chosen individual has excellent health given that he doesn't have health coverage?
Do having excellent health and having health coverage appear to be independent?
19 Burger preferences
A 2010 SurveyUSA poll asked 500 Los Angeles residents, “What is the best hamburger place in Southern California? Five Guys Burgers? In-N-Out Burger? Fat Burger? Tommy's Hamburgers? Umami Burger? Or somewhere else?” The distribution of responses by gender is shown below. 7
|
|
Gender |
|
| Best hamburger place |
Male |
Female |
Total |
| Five Guys Burgers |
5 |
6 |
11 |
| In-N-Out Burger |
162 |
181 |
343 |
| Fat Burger |
10 |
12 |
22 |
| Tommy's Hamburgers |
27 |
27 |
54 |
| Umami Burger |
5 |
1 |
6 |
| Other |
26 |
20 |
46 |
| Not Sure |
13 |
5 |
18 |
| Total |
248 |
252 |
500 |
- Are being female and liking Five Guys Burgers mutually exclusive? Answer
No, these events are not mutually exclusive, there are females who like Five Guys Burgers.
- What is the probability that a randomly chosen male likes In-N-Out the best? Answer
\(162/248 = 0.65\text{.}\)
- What is the probability that a randomly chosen female likes In-N-Out the best? Answer
- What is the probability that a man and a woman who are dating both like In-N-Out the best? Note any assumption you make and evaluate whether you think that assumption is reasonable. Answer
Under the assumption of a dating choices being independent of hamburger preference, which on the surface seems reasonable: \(0.65 \times 0.72 = 0.468\text{.}\)
- What is the probability that a randomly chosen person likes Umami best or that person is female? Answer
\((252 + 6 - 1)/500 = 0.514\)
20 Assortative mating
Assortative mating is a nonrandom mating pattern where individuals with similar genotypes and/or phenotypes mate with one another more frequently than what would be expected under a random mating pattern. Researchers studying this topic collected data on eye colors of 204 Scandinavian men and their female partners. The table below summarizes the results. For simplicity, we only include heterosexual relationships in this exercise. 8
|
|
Partner (female) |
|
|
|
Blue |
Brown |
Green |
Total |
| Self (male) |
Blue |
78 |
23 |
13 |
114 |
|
Brown |
19 |
23 |
12 |
54 |
|
Green |
11 |
9 |
16 |
36 |
|
Total |
108 |
55 |
41 |
204 |
What is the probability that a randomly chosen male respondent or his partner has blue eyes?
What is the probability that a randomly chosen male respondent with blue eyes has a partner with blue eyes?
What is the probability that a randomly chosen male respondent with brown eyes has a partner with blue eyes? What about the probability of a randomly chosen male respondent with green eyes having a partner with blue eyes?
Does it appear that the eye colors of male respondents and their partners are independent? Explain your reasoning.
21 Urns and marbles, Part I
Imagine you have an urn containing 5 red, 3 blue, and 2 orange marbles in it.
- What is the probability that the first marble you draw is blue? Answer
- Suppose you drew a blue marble in the first draw. If drawing with replacement, what is the probability of drawing a blue marble in the second draw? Answer
- Suppose you instead drew an orange marble in the first draw. If drawing with replacement, what is the probability of drawing a blue marble in the second draw? Answer
- If drawing with replacement, what is the probability of drawing two blue marbles in a row? Answer
\(0.3\times0.3=0.09\text{.}\)
- When drawing with replacement, are the draws independent? Explain. Answer
Yes, the population that is being sampled from is identical in each draw.
22 Socks in a drawer
In your sock drawer you have 4 blue, 5 gray, and 3 black socks. Half asleep one morning you grab 2 socks at random and put them on. Find the probability you end up wearing
2 blue socks
no gray socks
at least 1 black sock
a green sock
matching socks
23 Urns and marbles, Part II
Imagine you have an urn containing 5 red, 3 blue, and 2 orange marbles.
- Suppose you draw a marble and it is blue. If drawing without replacement, what is the probability the next is also blue? Answer
- Suppose you draw a marble and it is orange, and then you draw a second marble without replacement. What is the probability this second marble is blue? Answer
- If drawing without replacement, what is the probability of drawing two blue marbles in a row? Answer
\((3/10)\times(2/9) \approx 0.067\text{.}\)
- When drawing without replacement, are the draws independent? Explain. Answer
No. In this small population of marbles, removing one marble meaningfully changes the probability of what might be drawn next.
24 Books on a bookshelf
The table below shows the distribution of books on a bookcase based on whether they are nonfiction or fiction and hardcover or paperback.
|
|
Format |
|
|
Hardcover |
Paperback |
Total |
| Type |
Fiction |
13 |
59 |
72 |
|
Nonfiction |
15 |
8 |
23 |
|
Total |
28 |
67 |
95 |
Find the probability of drawing a hardcover book first then a paperback fiction book second when drawing without replacement.
Determine the probability of drawing a fiction book first and then a hardcover book second, when drawing without replacement.
Calculate the probability of the scenario in part (b), except this time complete the calculations under the scenario where the first book is placed back on the bookcase before randomly drawing the second book.
The final answers to parts (b) and (c) are very similar. Explain why this is the case.
25 Student outfits
In a classroom with 24 students, 7 students are wearing jeans, 4 are wearing shorts, 8 are wearing skirts, and the rest are wearing leggings. If we randomly select 3 students without replacement, what is the probability that one of the selected students is wearing leggings and the other two are wearing jeans? Note that these are mutually exclusive clothing options.
AnswerFor 1 leggings (L) and 2 jeans (J), there are three possible orderings: LJJ, JLJ, and JJL. The probability for LJJ is \((5/24)\times(7/23)\times(6/22) = 0.0173\text{.}\) The other two orderings have the same probability, and these three possible orderings are disjoint events. Final answer: 0.0519.
26 The birthday problem
Suppose we pick three people at random. For each of the following questions, ignore the special case where someone might be born on February 29th, and assume that births are evenly distributed throughout the year.
What is the probability that the first two people share a birthday?
What is the probability that at least two people share a birthday?
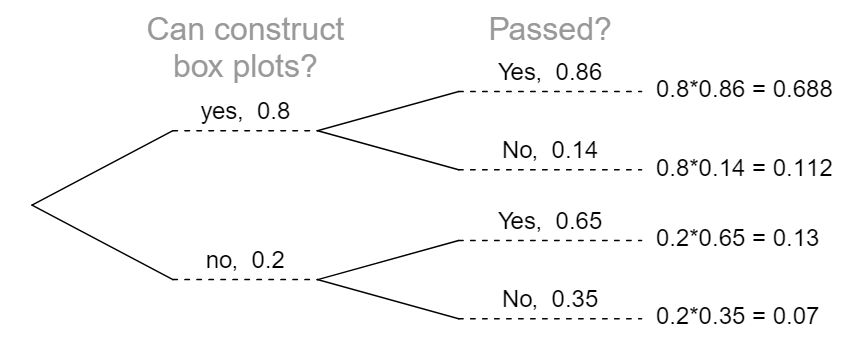
27 Drawing box plots
After an introductory statistics course, 80% of students can successfully construct box plots. Of those who can construct box plots, 86% passed, while only 65% of those students who could not construct box plots passed.
- Construct a tree diagram of this scenario. Answer
- Calculate the probability that a student is able to construct a box plot if it is known that he passed. Answer
\(P(\text{\scriptsize canconstruct} | \text{\scriptsize pass}) = \frac{P(\text{\scriptsize canconstructandpass})}{P(\text{\scriptsize pass})}\) \(= \frac{0.8 \times 0.86}{0.8 \times 0.86+0.2 \times 0.65} = \frac{0.688}{0.818} \approx 0.84\text{.}\)
28 Predisposition for thrombosis
A genetic test is used to determine if people have a predisposition for thrombosis, which is the formation of a blood clot inside a blood vessel that obstructs the flow of blood through the circulatory system. It is believed that 3% of people actually have this predisposition. The genetic test is 99% accurate if a person actually has the predisposition, meaning that the probability of a positive test result when a person actually has the predisposition is 0.99. The test is 98% accurate if a person does not have the predisposition. What is the probability that a randomly selected person who tests positive for the predisposition by the test actually has the predisposition?
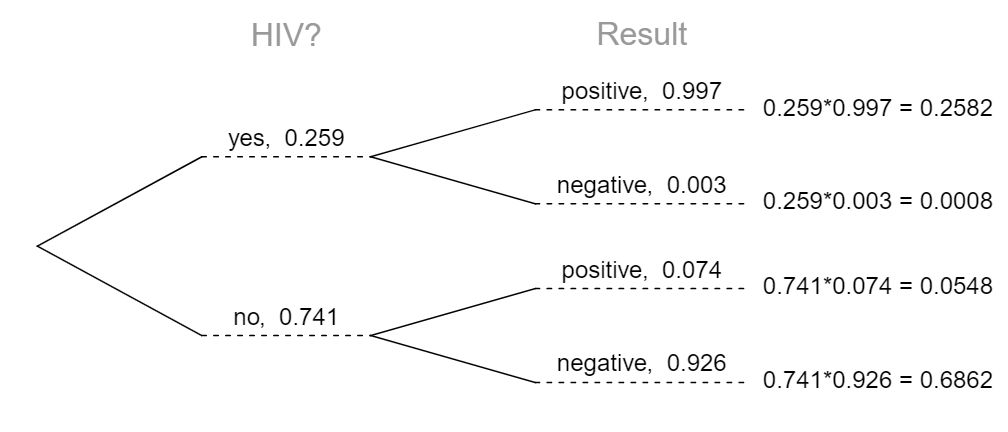
29 HIV in Swaziland
Swaziland has the highest HIV prevalence in the world: 25.9% of this country's population is infected with HIV. 9 The ELISA test is one of the first and most accurate tests for HIV. For those who carry HIV, the ELISA test is 99.7% accurate. For those who do not carry HIV, the test is 92.6% accurate. If an individual from Swaziland has tested positive, what is the probability that he carries HIV?
Answer
First draw a tree diagram:
Then compute the probability: \(P(HIV | +) = \frac{P(HIVand+)}{P(+)} = \frac{0.259 \times 0.997}{0.259 \times 0.997 + 0.741 \times 0.074}= \frac{0.2582}{0.3131} = 0.8247\text{.}\)
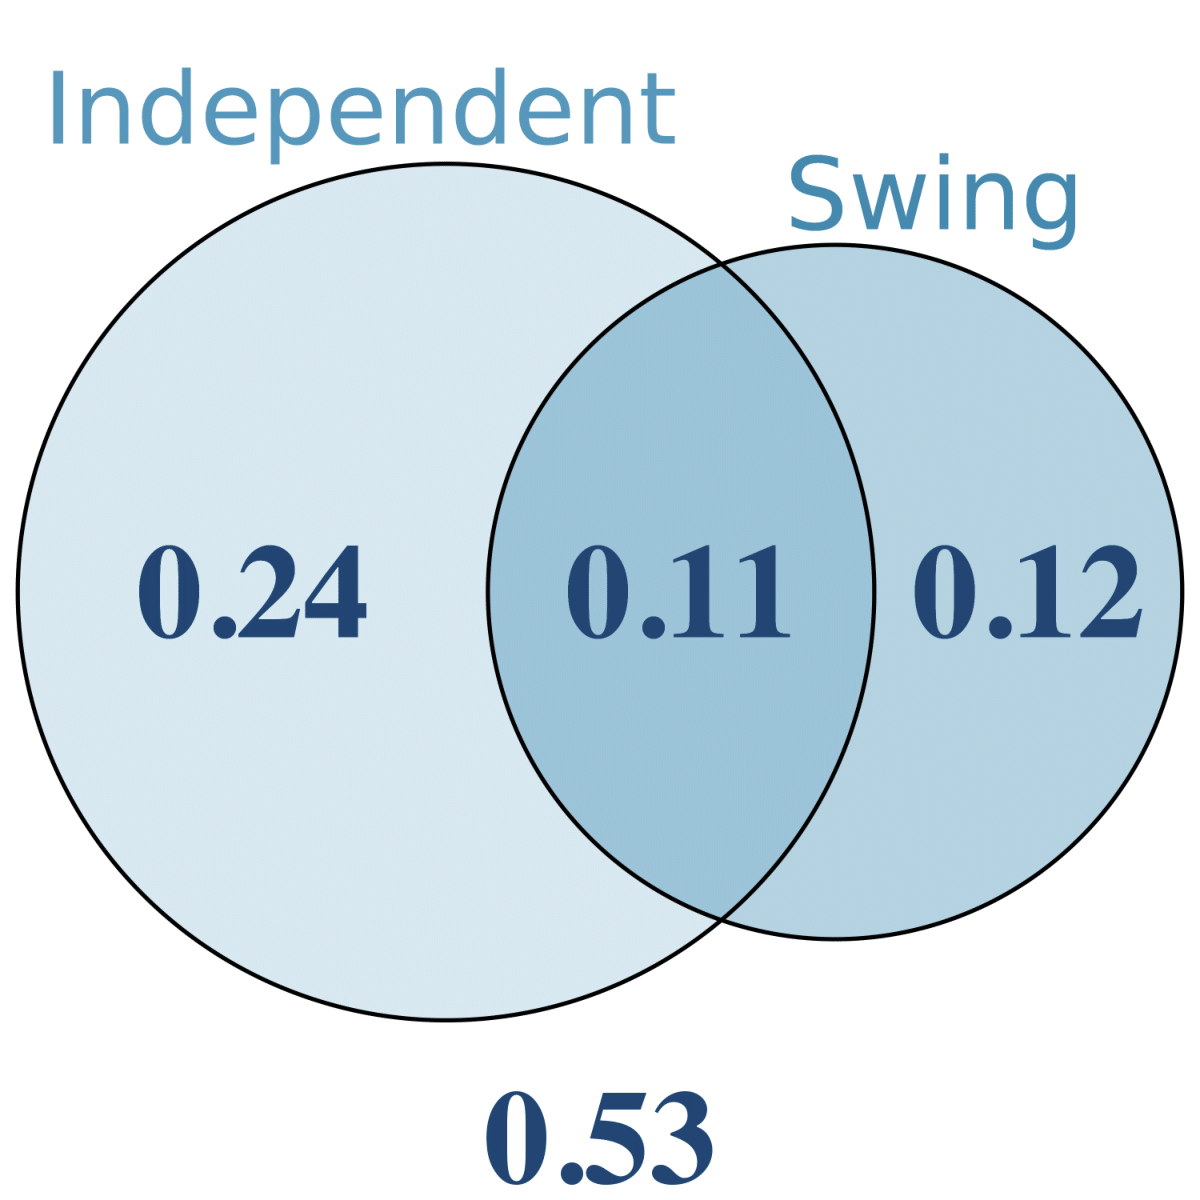
30 Exit poll
Edison Research gathered exit poll results from several sources for the Wisconsin recall election of Scott Walker. They found that 53% of the respondents voted in favor of Scott Walker. Additionally, they estimated that of those who did vote in favor for Scott Walker, 37% had a college degree, while 44% of those who voted against Scott Walker had a college degree. Suppose we randomly sampled a person who participated in the exit poll and found that he had a college degree. What is the probability that he voted in favor of Scott Walker? 10
31 It's never lupus
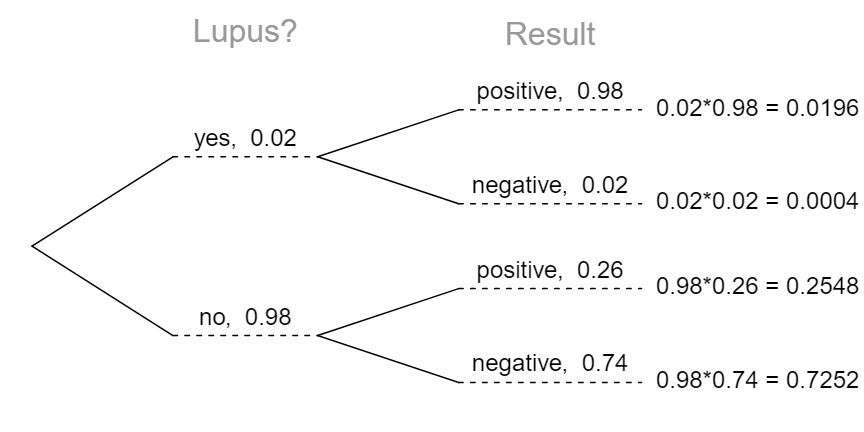
Lupus is a medical phenomenon where antibodies that are supposed to attack foreign cells to prevent infections instead see plasma proteins as foreign bodies, leading to a high risk of blood clotting. It is believed that 2% of the population suffer from this disease. The test is 98% accurate if a person actually has the disease. The test is 74% accurate if a person does not have the disease. There is a line from the Fox television show House that is often used after a patient tests positive for lupus: “It's never lupus.” Do you think there is truth to this statement? Use appropriate probabilities to support your answer.
Answer
A tree diagram of the situation:
\(P(\text{lupus} | \text{positive}) = \frac{P(\text{\text{lupusandpositive}})}{P(\text{positive})} = \frac{0.0196}{0.0196 + 0.2548} = 0.0714\text{.}\) Even when a patient tests positive for lupus, there is only a 7.14% chance that he actually has lupus. While House is not exactly right -- it is possible that the patient has lupus -- his implied skepticism is warranted.
32 Twins
About 30% of human twins are identical, and the rest are fraternal. Identical twins are necessarily the same sex — half are males and the other half are females. One-quarter of fraternal twins are both male, one-quarter both female, and one-half are mixes: one male, one female. You have just become a parent of twins and are told they are both girls. Given this information, what is the probability that they are identical?
