
Section 1.3 Overview of data collection principles
The first step in conducting research is to identify topics or questions that are to be investigated. A clearly laid out research question is helpful in identifying what subjects or cases should be studied and what variables are important. It is also important to consider how data are collected so that they are reliable and help achieve the research goals.
OpenIntro: Overview of Data Collection Principles video
Subsection 1.3.1 Populations and samples
¶Consider the following three research questions:
What is the average mercury content in swordfish in the Atlantic Ocean?
Over the last 5 years, what is the average time to complete a degree for Duke undergraduate students?
Does a new drug reduce the number of deaths in patients with severe heart disease?
Each research question refers to a target population. In the first question, the target population is all swordfish in the Atlantic ocean, and each fish represents a case. Often times, it is too expensive to collect data for every case in a population. Instead, a sample is taken. A sample represents a subset of the cases and is often a small fraction of the population. For instance, 60 swordfish (or some other number) in the population might be selected, and this sample data may be used to provide an estimate of the population average and answer the research question.
Guided Practice 1.3.2.
For the second and third questions above, identify the target population and what represents an individual case. 1 Item 2 Notice that this question is only relevant to students who complete their degree; the average cannot be computed using a student who never finished her degree. Thus, only Duke undergraduate students who have graduated in the last five years are part of the population of interest. Each such student would represent an individual case. Item 3 A person with severe heart disease represents a case. The population includes all people with severe heart disease.
We collect a sample of data to better understand the characteristics of a population. A variable is a characteristic we measure for each individual or case. The overall quantity of interest may be the mean, median, proportion, or some other summary of a population. These population values are called parameters. We estimate the value of a parameter by taking a sample and computing a numerical summary called a statistic based on that sample. Note that the two p's (population, parameter) go together and the two s's (sample, statistic) go together.
Example 1.3.3.
Earlier we asked the question: what is the average mercury content in swordfish in the Atlantic Ocean? Identify the variable to be measured and the parameter and statistic of interest.
The variable is the level of mercury content in swordfish in the Atlantic Ocean. It will be measured for each individual swordfish. The parameter of interest is the average mercury content in all swordfish in the Atlantic Ocean. If we take a sample of 50 swordfish from the Atlantic Ocean, the average mercury content among just those 50 swordfish will be the statistic.
Two statistics we will study are the mean (also called the average) and proportion. When we are discussing a population, we label the mean as \(\mu\) (the Greek letter, mu), while we label the sample mean as \(\bar{x}\) (read as x-bar). When we are discussing a proportion in the context of a population, we use the label \(p\text{,}\) while the sample proportion has a label of \(\hat{p}\) (read as p-hat). Generally, we use \(\bar{x}\) to estimate the population mean, \(\mu\text{.}\) Likewise, we use the sample proportion \(\hat{p}\) to estimate the population proportion, \(p\text{.}\)
Example 1.3.4.
Is \(\mu\) a parameter or statistic? What about \(\hat{p}\text{?}\)
\(\mu\) is a parameter because it refers to the average of the entire population. \(\hat{p}\) is a statistic because it is calculated from a sample.
Example 1.3.5.
For the second question regarding time to complete a degree for a Duke undergraduate, is the variable numerical or categorical? What is the parameter of interest?
The characteristic that we record on each individual is the number of years until graduation, which is a numerical variable. The parameter of interest is the average time to degree for all Duke undergraduates, and we use \(\mu\) to describe this quantity.
Guided Practice 1.3.6.
The third question asked whether a new drug reduces deaths in patients with severe heart disease. Is the variable numerical or categorical? Describe the statistic that should be calculated in this study. 2 The variable is whether or not a patient with severe heart disease dies within the time frame of the study. This is categorical because it will be a yes or a no. The statistic that should be recorded is the proportion of patients that die within the time frame of the study, and we would use \(\hat{p}\) to denote this quantity.
If these topics are still a bit unclear, don't worry. We'll cover them in greater detail in the next chapter.
Subsection 1.3.2 Anecdotal evidence
¶Consider the following possible responses to the three research questions:
A man on the news got mercury poisoning from eating swordfish, so the average mercury concentration in swordfish must be dangerously high.
I met two students who took more than 7 years to graduate from Duke, so it must take longer to graduate at Duke than at many other colleges.
My friend's dad had a heart attack and died after they gave him a new heart disease drug, so the drug must not work.
Each conclusion is based on data. However, there are two problems. First, the data only represent one or two cases. Second, and more importantly, it is unclear whether these cases are actually representative of the population. Data collected in this haphazard fashion are called anecdotal evidence.

In February 2010, some media pundits cited one large snow storm as valid evidence against global warming. As comedian Jon Stewart pointed out, “It's one storm, in one region, of one country.”
Anecdotal evidence.
Be careful of making inferences based on anecdotal evidence. Such evidence may be true and verifiable, but it may only represent extraordinary cases. The majority of cases and the average case may in fact be very different.
Anecdotal evidence typically is composed of unusual cases that we recall based on their striking characteristics. For instance, we may vividly remember the time when our friend bought a lottery ticket and won $250 but forget most the times she bought one and lost. Instead of focusing on the most unusual cases, we should examine a representative sample of many cases.
Subsection 1.3.3 Explanatory and response variables
¶Consider the following question from Figure 1.2.11 for the county data set:
Is federal spending, on average, higher or lower in counties with high rates of poverty?
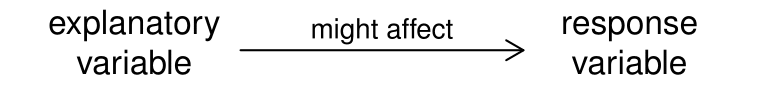
If we suspect poverty might affect spending in a county, then poverty is the explanatory variable and federal spending is the response variable in the relationship. 3 Sometimes the explanatory variable is called the independent variable and the response variable is called the dependent variable. However, this becomes confusing since a pair of variables might be independent or dependent, so we avoid this language. If there are many variables, it may be possible to consider a number of them as explanatory variables.
TIP: Explanatory and response variables.
To identify the explanatory variable in a pair of variables, identify which of the two is suspected of affecting the other.
Caution: Association does not imply causation.
Labeling variables as explanatory and response does not guarantee the relationship between the two is actually causal, even if there is an association identified between the two variables. We use these labels only to keep track of which variable we suspect affects the other.
In many cases, the relationship is complex or unknown. It may be unclear whether variable \(A\) explains variable \(B\) or whether variable \(B\) explains variable \(A\text{.}\) For example, it is now known that a particular protein called REST is much depleted in people suffering from Alzheimer's disease. While this raises hopes of a possible approach for treating Alzheimer's, it is still unknown whether the lack of the protein causes brain deterioration, whether brain deterioration causes depletion in the REST protein, or whether some third variable causes both brain deterioration and REST depletion. That is, we do not know if the lack of the protein is an explanatory variable or a response variable. Perhaps it is both. 4 www.nytimes.com/2014/03/20/health/fetal-gene-may-protect-brain-from-alzheimers-study-finds.html
Subsection 1.3.4 Observational studies versus experiments
There are two primary types of data collection: observational studies and experiments.
Researchers perform an observational study when they collect data without interfering with how the data arise. For instance, researchers may collect information via surveys, review medical or company records, or follow a cohort of many similar individuals to study why certain diseases might develop. In each of these situations, researchers merely observe or take measurements of things that arise naturally.
When researchers want to investigate the possibility of a causal connection, they conduct an experiment. For all experiments, the researchers must impose a treatment. For most studies there will be both an explanatory and a response variable. For instance, we may suspect administering a drug will reduce mortality in heart attack patients over the following year. To check if there really is a causal connection between the explanatory variable and the response, researchers will collect a sample of individuals and split them into groups. The individuals in each group are assigned a treatment. When individuals are randomly assigned to a group, the experiment is called a randomized experiment. For example, each heart attack patient in the drug trial could be randomly assigned into one of two groups: the first group receives a placebo (fake treatment) and the second group receives the drug. See the case study in Section 1.1 for another example of an experiment, though that study did not employ a placebo.
Example 1.3.8.
Suppose that a researcher is interested in the average tip customers at a particular restaurant give. Should she carry out an observational study or an experiment?
In addressing this question, we ask, “Will the researcher be imposing any treatment?” Because there is no treatment or interference that would be applicable here, it will be an observational study. Additionally, one consideration the researcher should be aware of is that, if customers know their tips are being recorded, it could change their behavior, making the results of the study inaccurate.
TIP: Association \(\neq \) causation.
In general, association does not imply causation, and causation can only be inferred from a randomized experiment.