
Cartesian Coordinate System
The Cartesian coordinate system identifies the location of every point in a plane with an ordered pair.
The Cartesian coordinate system identifies the location of every point in a plane with an ordered pair.
On paper, sketch a Cartesian coordinate system with units, and then plot the following points: \((3,2),(-5,-1),(0,-3),(4,0)\text{.}\)

To graph an equation with two variables \(x\) and \(y\text{,}\) we can choose some reasonable \(x\)-values, then calculate the corresponding \(y\)-values, and then plot the \((x,y)\)-pairs as points. For many (not-so-complicated) algebraic equations, connecting those points with a smooth curve will produce an excellent graph.
Graph the equation \(y=-2x+5\text{.}\)
| \(x\) | \(y=-2x+5\) | Point |
| \(-2\) | \(\phantom{-2(-2)+5=\substitute{9}}\) | \(\phantom{(-2,9)}\) |
| \(-1\) | \(\phantom{-2(-1)+5=\substitute{7}}\) | \(\phantom{(-1,7)}\) |
| \(0\) | \(\phantom{-2(0)+5=\substitute{5}}\) | \(\phantom{(0,5)}\) |
| \(1\) | \(\phantom{-2(1)+5=\substitute{3}}\) | \(\phantom{(1,3)}\) |
| \(2\) | \(\phantom{-2(2)+5=\substitute{1}}\) | \(\phantom{(2,1)}\) |
| \(x\) | \(y=-2x+5\) | Point |
| \(-2\) | \(-2(-2)+5=\substitute{9}\) | \((-2,9)\) |
| \(-1\) | \(-2(-1)+5=\substitute{7}\) | \((-1,7)\) |
| \(0\) | \(-2(0)+5=\substitute{5}\) | \((0,5)\) |
| \(1\) | \(-2(1)+5=\substitute{3}\) | \((1,3)\) |
| \(2\) | \(-2(2)+5=\substitute{1}\) | \((2,1)\) |
We use points from the table to graph the equation. First, plot each point carefully. Then, connect the points with a smooth curve. Here, the curve is a straight line. Lastly, we can communicate that the graph extends further by sketching arrows on both ends of the line.


For a linear relationship, by its data in a table, we can see the rate of change (slope) and the line's \(y\)-intercept, thus writing the equation.
Write an equation in the form \(y=\ldots\) suggested by the pattern in the table.
| \(x\) | \(y\) |
| \(0\) | \(-4\) |
| \(1\) | \(-6\) |
| \(2\) | \(-8\) |
| \(3\) | \(-10\) |
We consider how the values change from one row to the next. From row to row, the \(x\)-value increases by \(1\text{.}\) Also, the \(y\)-value decreases by \(2\) from row to row.
| \(x\) | \(y\) | ||
| \(0\) | \(-4\) | ||
| \({}+1\rightarrow\) | \(1\) | \(-6\) | \(\leftarrow{}-2\) |
| \({}+1\rightarrow\) | \(2\) | \(-8\) | \(\leftarrow{}-2\) |
| \({}+1\rightarrow\) | \(3\) | \(-10\) | \(\leftarrow{}-2\) |
Since row-to-row change is always \(1\) for \(x\) and is always \(-2\) for \(y\text{,}\) the rate of change from one row to another row is always the same: \(-2\) units of \(y\) for every \(1\) unit of \(x\text{.}\)
We know that the output for \(x = 0\) is \(y = -4\text{.}\) And our observation about the constant rate of change tells us that if we increase the input by \(x\) units from \(0\text{,}\) the ouput should decrease by \(\overbrace{(-2)+(-2)+\cdots+(-2)}^{x\text{ times}}\text{,}\) which is \(-2x\text{.}\) So the output would be \(-4-2x\text{.}\)
So the equation is \(y=-2x-4\text{.}\)
When \(x\) and \(y\) are two variables where the rate of change between any two points is always the same, we call this common rate of change the slope. Since having a constant rate of change means the graph will be a straight line, it's also called the slope of the line.
We can find a line's slope by drawing a slope-triangle on the line's graph, and then using the formula
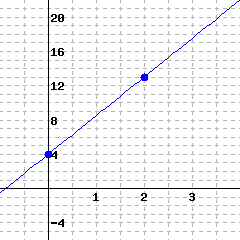
Find the slope of the line in the following graph.

We picked two points on the line, and then drew a slope triangle. Next, we will do:
The line's slope is \(4\text{.}\)
If we know two points on a line, we can find its slope without graphing and, instead, using the slope formula \(\text{slope}=\frac{y_2-y_1}{x_2-x_1}\)
A line passes the points \((-5,25)\) and \((4,-2)\text{.}\) Find this line's slope.
The line's slope is \(-3\text{.}\)
A line's equation in slope-intercept form looks like \(y=mx+b\text{,}\) where \(m\) is the line's slope, and \(b\) is the line's \(y\)-intercept.
We can use a line's \(y\)-intercept and slope triangles to graph it.
Graph the line \(y=-\frac{2}{3}x+10\text{.}\)


Given a line's graph, we can identify its \(y\)-intercept, and then find its slope by a slope triangle. With a line's slope and \(y\)-intercept, we can write its equation in the form of \(y=mx+b\text{.}\)
Find the equation of the line in the graph.


With the line's slope \(-\frac{2}{3}\) and \(y\)-intercept \(10\text{,}\) we can write the line's equation in slope-intercept form: \(y=-\frac{2}{3}x+10\text{.}\)
A line's point-slope form equation is in the form of \(y=m\left(x-x_0\right)+y_0\text{,}\) where \(m\) is the line's slope, and \((x_0,y_0)\) is a point on the line.
A line passes through \((-6,0)\) and \((9,-10)\text{.}\) Find this line's equation in both point-slope and slope-intercept form.
We will use the slope formula (4.4.3) to find the slope first. After labeling those two points as \((\overset{x_1}{-6},\overset{y_1}{0}) \text{ and } (\overset{x_2}{9},\overset{y_2}{-10})\text{,}\) we have:
Now the point-slope equation looks like \(y=-\frac{2}{3}(x-x_0)+y_0\text{.}\) Next, we will use \((9,-10)\) and substitute \(x_0\) with \(9\) and \(y_0\) with \(-10\text{,}\) and we have:
Next, we will change the point-slope equation into slope-intercept form:
A line's equation in standard form looks like \(Ax+By=C\text{.}\) We need to convert a line's equation from standard form to slope-intercept form, and vice versa.
Converting from Standard Form to Slope-Intercept Form
Convert \(2x+3y=6\) into slope-intercept form.
The line's equation in slope-intercept form is \(y=-\frac{2}{3}x+2\text{.}\)
Converting from Slope-Intercept Form to Standard Form
Convert \(y=-\frac{2}{3}x+2\) into standard form.
The line's equation in standard form is \(2x+3y=6\text{.}\)
To graph a line in standard form, we could first change it to slope-intercept form, and then graph the line by its \(y\)-intercept and slope triangles. A second method is to graph the line by its \(x\)-intercept and \(y\)-intercept.
Graph \(2x-3y=-6\) using its intercepts. And then use the intercepts to calculate the line's slope.
We calculate the line's \(x\)-intercept by substituting \(y=0\) into the equation
So the line's \(x\)-intercept is \((-3,0)\text{.}\)
Similarly, we substitute \(x=0\) into the equation to calculate the \(y\)-intercept:
So the line's \(y\)-intercept is \((0,2)\text{.}\)
With both intercepts' coordinates, we can graph the line:

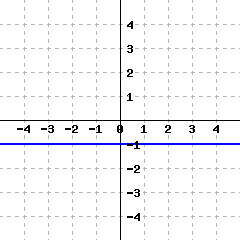
A horizontal line's equation looks like \(y=k\text{,}\) while a vertical line's equation looks like \(x=h\text{.}\) The following figure has graphs of a horizontal line and a vertical line.

Two lines are parallel if and only if they have the same slope.
Line \(m\)'s equation is \(y=-2x+20\text{.}\) Line \(n\) is parallel to \(m\text{,}\) and line \(n\) also passes the point \((4,-3)\text{.}\) Find line \(n\)'s equation.
Since parallel lines have the same slope, line \(n\)'s slope is also \(-2\text{.}\) Since line \(n\) also passes the point \((4,-3)\text{,}\) we can write line \(n\)'s equation in point-slope form:
We can also easily get the line's equation in slope-intercept form:
Two lines are perpendicular if and only if the product of their slopes is \(-1\text{.}\)
Line \(m\)'s equation is \(y=-2x+20\text{.}\) Line \(n\) is perpendicular to \(m\text{,}\) and line \(n\) also passes the point \((4,-3)\text{.}\) Find line \(n\)'s equation.
Since line \(m\) and \(n\) are perpendicular, the product of their slopes is \(-1\text{.}\) Because line \(m\)'s slope is given as \(-2\text{,}\) we can find line \(n\)'s slope is \(\frac{1}{2}\text{.}\)
Since line \(n\) also passes the point \((4,-3)\text{,}\) we can write line \(n\)'s equation in point-slope form:
We can also easily get the line's equation in slope-intercept form:
When we graph lines like \(y=2x+1\text{,}\) we are graphing points which satisfy the relationship \(y=2x+1\text{,}\) like \((0,1), (1,3), (2,5)\text{,}\) etc. Similarly, we can graph linear inequalities like \(y\gt2x+1\) by plotting all points which satisfies the inequality, like \((0,2), (0,3), (1,4), (1,5)\text{,}\) etc. All these points form a region, instead of a line.
Graph \(y\gt2x+1\text{.}\)
There are two steps to graph an inequality.


Sketch the points \((8,2)\text{,}\) \((5,5)\text{,}\) \((-3,0)\text{,}\) \(\left(0,-\frac{14}{3}\right)\text{,}\) \((3,-2.5)\text{,}\) and \((-5,7)\) on a Cartesian plane.
Consider the equation
\(y=-\frac{5}{6} x-1\)
Which of the following ordered pairs are solutions to the given equation? There may be more than one correct answer.
\( (18,-11)\)
\( (-30,24)\)
\( (-6,5)\)
\( (0,-1)\)
| \(x\) | \(y\) |
| \(0\) | \({-4}\) |
| \(1\) | \({-2}\) |
| \(2\) | \({0}\) |
| \(3\) | \({2}\) |
Write an equation in the form \(y=\ldots\) suggested by the pattern in the table.
| \(x\) | \(y\) |
| \(0\) | \({3}\) |
| \(1\) | \({-2}\) |
| \(2\) | \({-7}\) |
| \(3\) | \({-12}\) |
Write an equation in the form \(y=\ldots\) suggested by the pattern in the table.
A line’s graph is shown below.
The slope of this line is . (If the slope does not exist, enter DNE or NONE.)
A line’s graph is shown below.

The slope of this line is . (If the slope does not exist, enter DNE or NONE.)
A line passes through the points \((-4,{9})\) and \((8,{0})\text{.}\) Find this line’s slope. If the slope does not exist, you may enter DNE or NONE.
This line’s slope is .
A line passes through the points \((1,-5)\) and \((-4,-5)\text{.}\) Find this line’s slope. If the slope does not exist, you may enter DNE or NONE.
This line’s slope is .
A line passes through the points \((-2,-2)\) and \((-2,4)\text{.}\) Find this line’s slope. If the slope does not exist, you may enter DNE or NONE.
This line’s slope is .
A line’s graph is given.

This line’s slope-intercept equation is
Find the line’s slope and \(y\)-intercept.
A line has equation \(\displaystyle{ 5x-6y=12 }\text{.}\)
This line’s slope is .
This line’s \(y\)-intercept is .
A line passes through the points \((0,{-2})\) and \((27,{19})\text{.}\) Find this line’s equation in point-slope form.
Using the point \((0,{-2})\text{,}\) this line’s point-slope form equation is .
Using the point \((27,{19})\text{,}\) this line’s point-slope form equation is .
Scientists are conducting an experiment with a gas in a sealed container. The mass of the gas is measured, and the scientists realize that the gas is leaking over time in a linear way. Its mass is leaking by \(3.6\) grams each minute. Six minutes since the experiment started, the remaining gas had a mass of \(154.8\) grams.
Let \(x\) be the number of minutes that have passed since the experiment started, and let \(y\) be the mass of the gas in grams at that moment. Use a linear equation to model the weight of the gas over time.
This line’s slope-intercept equation is .
\(34\) minutes after the experiment started, there would be grams of gas left.
If a linear model continues to be accurate, minutes since the experiment started, all gas in the container will be gone.
Find the \(y\)-intercept and \(x\)-intercept of the line given by the equation
\(\displaystyle{8 x + 7 y = -168}\)
If a particular intercept does not exist, enter none into all the answer blanks for that row.
| \(x\)-value | \(y\)-value | Location | |
| \(y\)-intercept | |||
| \(x\)-intercept |
Rewrite \({y}={2x+2}\) in standard form.
Rewrite \(y=-\frac{3}{4}x - 2\) in standard form.
Fill out this table for the equation \(x=-8\text{.}\) The first row is an example.
| \(x\) | \(y\) | Points |
| \(-8\) | \(-3\) | \(\left(-8,-3\right)\) |
| \(-2\) | ||
| \(-1\) | ||
| \(0\) | ||
| \(1\) | ||
| \(2\) |
A line’s graph is given.
This line’s equation is
Line \(m\) passes points \((0,-6)\) and \((0,6)\text{.}\)
Line \(n\) passes points \((-1,-3)\) and \((-1,-1)\text{.}\)
Determine how the two lines are related.
These two lines are
parallel
perpendicular
neither parallel nor perpendicular
Line \(k\)’s equation is \(y={-{\frac{6}{7}}x+2}\text{.}\)
Line \(\ell\) is perpendicular to line \(k\) and passes through the point \((12,{15})\text{.}\)
Find an equation for line \(\ell\) in both slope-intercept form and point-slope forms.
An equation for \(\ell\) in slope-intercept form is: .
An equation for \(\ell\) in point-slope form is: .