
Section 13.7 Solving Inequalities Graphically
¶Objectives: PCC Course Content and Outcome Guide
In this text, we have mostly focused on solving inequalities algebraically. While we have had some practice solving inequalities graphically 11.3.3 with technology, we want to solidify those skills. Solving using graphing is special because the graphing utility we use can do much of the heavy lifting and all that is left is to analyze the graph that is shown to us. So let's let our favorite graphing program make some graphs for us and then we can interpret the results.
Alternative Video Lesson.
Subsection 13.7.1 Solving Inequalities Graphically
Example 13.7.1.
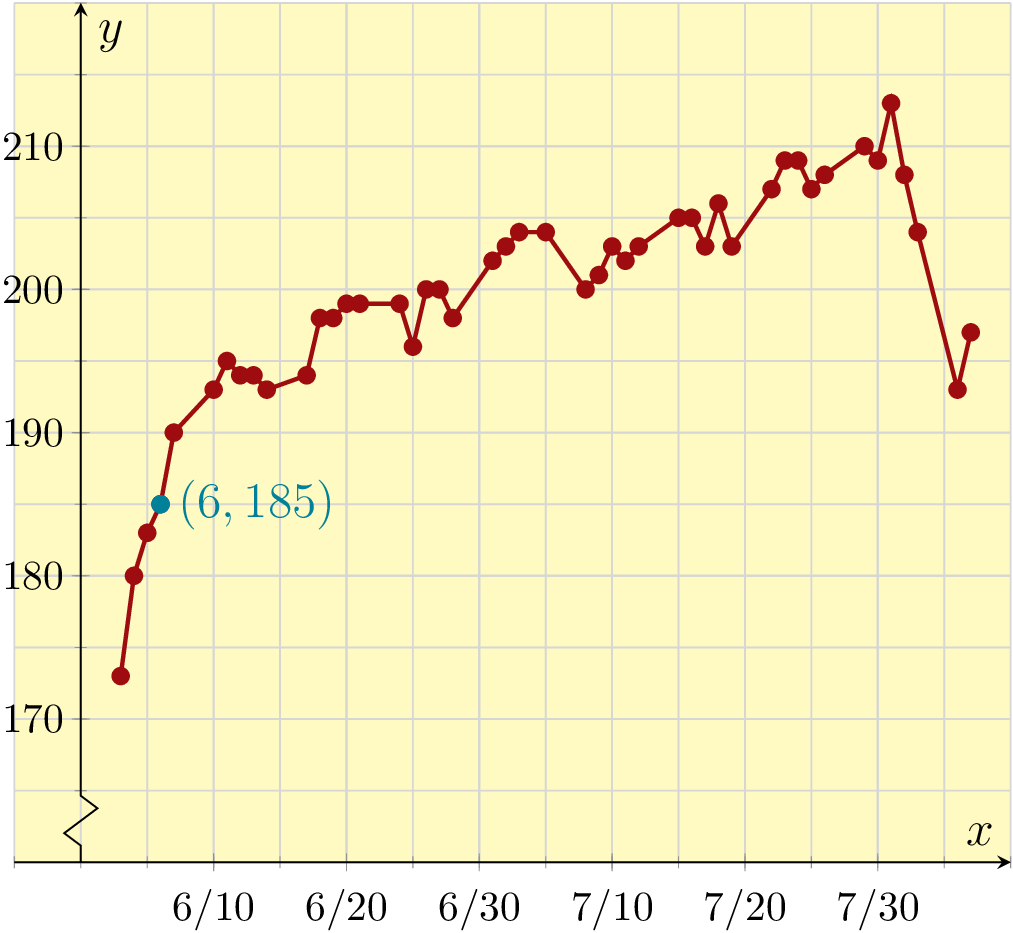
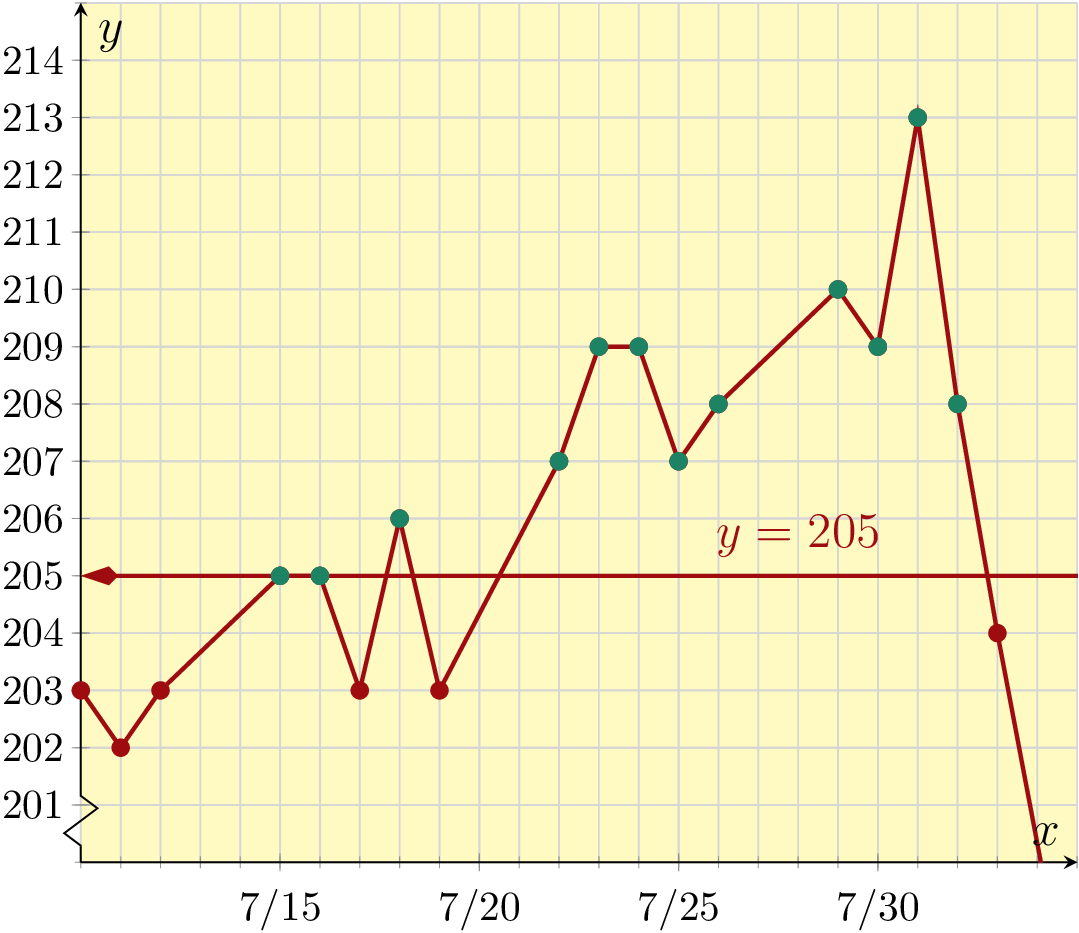
Business leaders and professionals around the world concern themselves with money and how to grow their wealth. While a vast majority of people who live in the United States own few or no stocks, the stock market is important to learn about for anyone interested in earning a retirement. Stock owners need to know when to buy or sell their stocks to make a profit and the most essential tool to do so is the ability to read a graph. Let's examine a graph of the actual closing value of Apple (AAPL) stock from June 3, 2019 to August 6, 2019.

If a person bought the stock on June 6, when the stock was valued at \(\$185\) per share, and they wanted at least a \(\$20\) per share profit, during what days could they have sold that stock?
If we want a \(\$20\) per share profit, then we should be interested in stock prices of \(\$205\) or more. Let's draw a line at \(y=205\text{,}\) representing the price of \(\$205\text{,}\) and find any days when the stock was on or above that line. According to the graph, there are several dates in question in starting in late July. Let's zoom in on those dates to read our solutions better.

With a zoomed-in and rescaled graph, we can clearly see the dates that would have resulted in a \(\$20\) per share profit. Those dates were July 15, 16, 18, 22, 23, 24, 25, 26, 29, 30, 31, and August 1. Keep in mind that the stock market is closed on weekends and holidays, so we are only counting the solid dots as our solutions.

Let's turn to an example involving a linear equation.
Example 13.7.5.
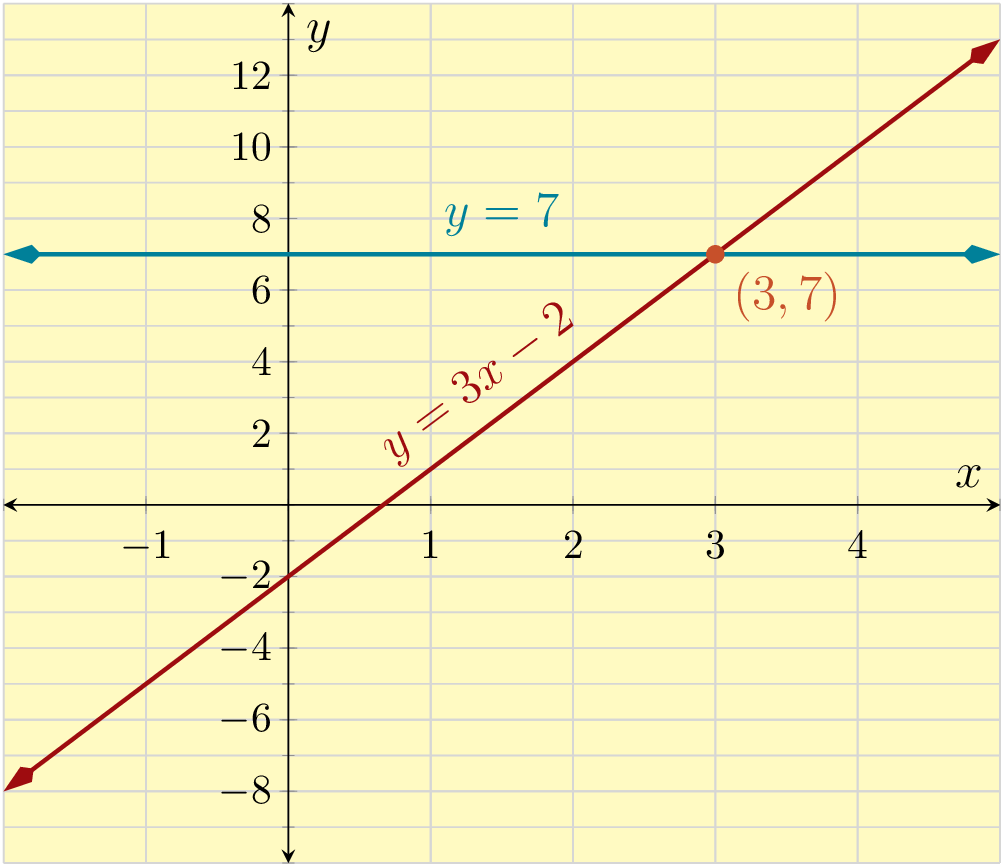
Solve the inequality \(3x-2\lt7\) graphically.
To solve any inequality (or equation) graphically, we first take each side of the equation and graph \(y=\text{"left hand side"}\) and \(y=\text{"right hand side"}\text{.}\) In this case, that would be \(y=3x-2\) and \(y=7\text{.}\) Now we can see that the graphs of \(y=3x-2\) and \(y=7\) intersect at the point \((3,7)\text{.}\)

Since we are trying to solve the inequality \(3x-2\lt7\text{,}\) we need to examine the graph for where (what \(x\)-values) the graph of \(y=3x-2\) is below the graph of \(y=7\text{.}\) This happens for \(x\)-values less than \(3\text{.}\) So we would say that the solution set to \(3x-2\lt7\) is \((-\infty,3)\text{.}\) It is review to solve the inequality algebraically to verify our result.

Subsection 13.7.2 Solving Absolute Value and Quadratic Inequalities Graphically
Recall in Section 13.4 that we learned that graphs of absolute value function are in general shaped like “V”s. We can now solve some absolute value inequalities graphically.
Example 13.7.8.
Graphically solving the inequality \(\abs{2x-1} \le 5\) means looking for the \(x\)-values where the graph of \(y=\abs{2x-1}\) is below (or touching) the line \(y=5\text{.}\) On the graph the highlighted region of \(y=\abs{2x-1}\) is the portion that is below the line \(y=5\text{,}\) and the \(x\)-values in that region are \([-2,5]\text{.}\)

Example 13.7.10.
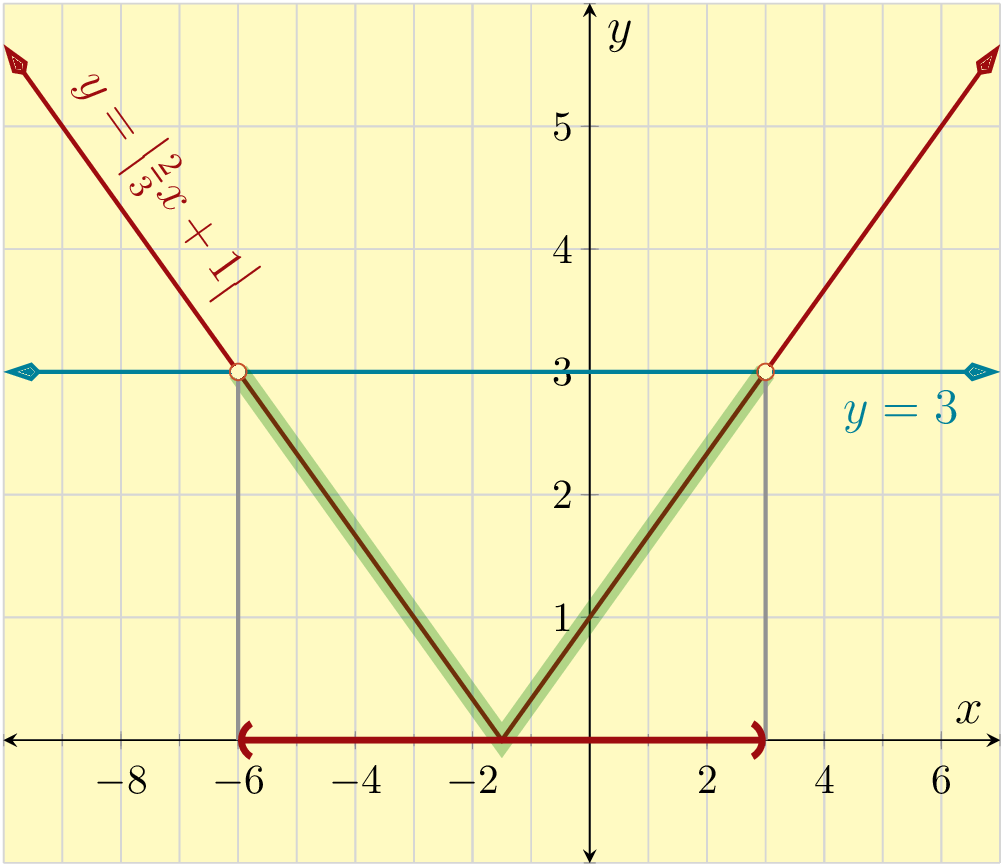
Solve the inequality \(\abs{\frac{2}{3}x+1} \lt 3\) graphically.
To solve the inequality \(\abs{\frac{2}{3}x+1} \lt 3\text{,}\) we will start by making a graph with both \(y=\abs{\frac{2}{3}x+1}\) and \(y=3\text{.}\)
The portion of the graph of \(y=\abs{\frac{2}{3}x+1}\) that is below \(y=3\) is highlighted and the \(x\)-values of that highlighted region are trapped between \(-6\) and \(3\text{:}\) \(-6 \lt x \lt 3\text{.}\) That means that the solution set is \((-6,3)\text{.}\) Note that we shouldn't include the endpoints of the interval because at those values, the two graphs are equal whereas the original inequality was only less than and not equal.

The last examples had absolute value expressions being less than some value. We now need to investigate what happens when we have an absolute value expression that is greater than a value.
Example 13.7.12.
To graphically solve the inequality \(\abs{x-1} \gt 3\) would mean looking for the \(x\)-values where the graph of \(y=\abs{x-1}\) is above the line \(y=3\text{.}\)

Example 13.7.14.
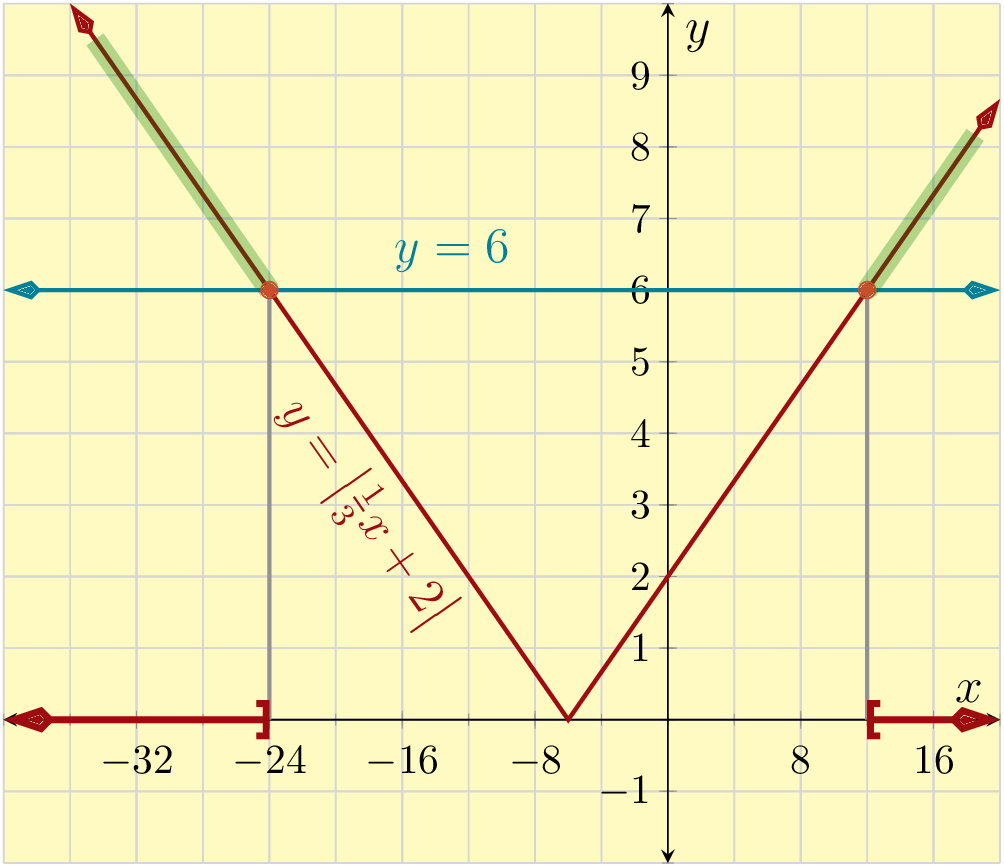
Solve the inequality \(\abs{\frac{1}{3}x+2} \ge 6\) graphically.
To solve the inequality \(\abs{\frac{1}{3}x+2} \ge 6\text{,}\) we will start by making a graph with both \(y=\abs{\frac{1}{3}x+2}\) and \(y=6\text{.}\)
The portion of the graph of \(y=\abs{\frac{1}{3}x+2}\) that is above \(y=6\) is highlighted and the \(x\)-values of that highlighted region are those below (or equal to) \(-24\) and those above (or equal to) \(12\text{:}\) \(x \le -24 \text{ or } x \ge 12\text{.}\) That means that the solution set is \((-\infty,-24)\cup(12,\infty)\text{.}\)

Solving inequalities with quadratic expressions graphically is very similar to solving absolute value inequalities graphically.
Example 13.7.16.
Graphically solve the following quadratic inequalities.
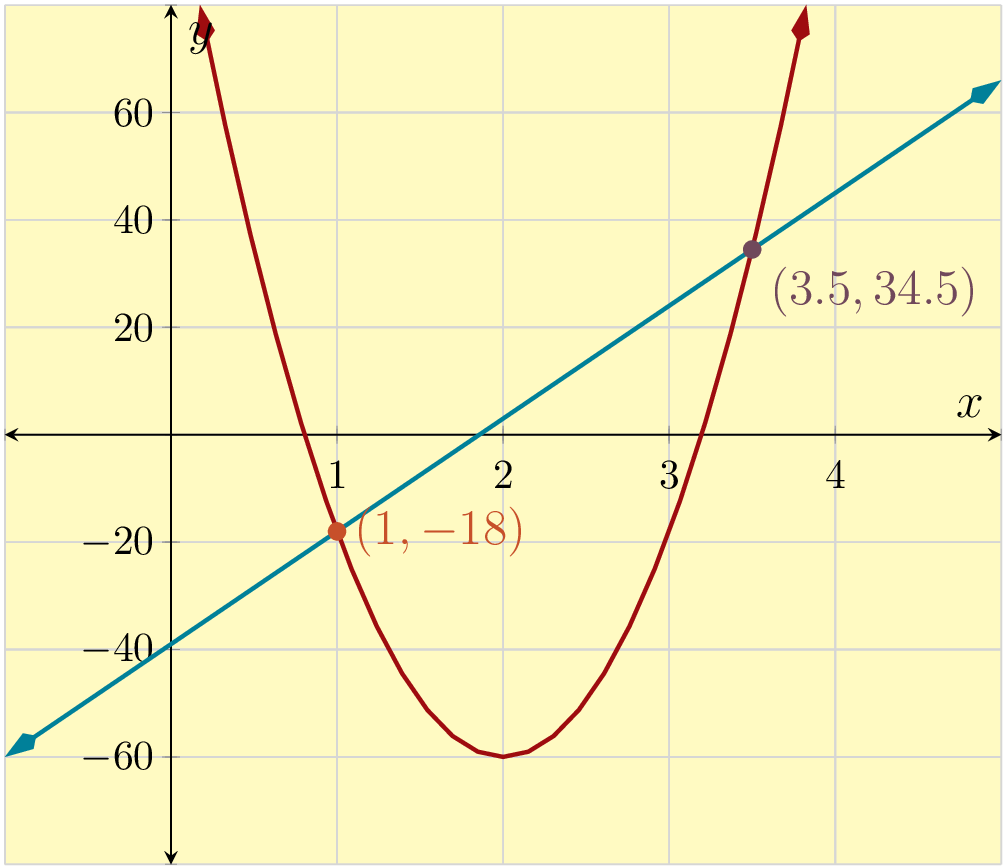
\(42(x-2)^2-60 \geq 21x-39\)
\(42(x-2)^2-60 \lt 21x-39\)

-
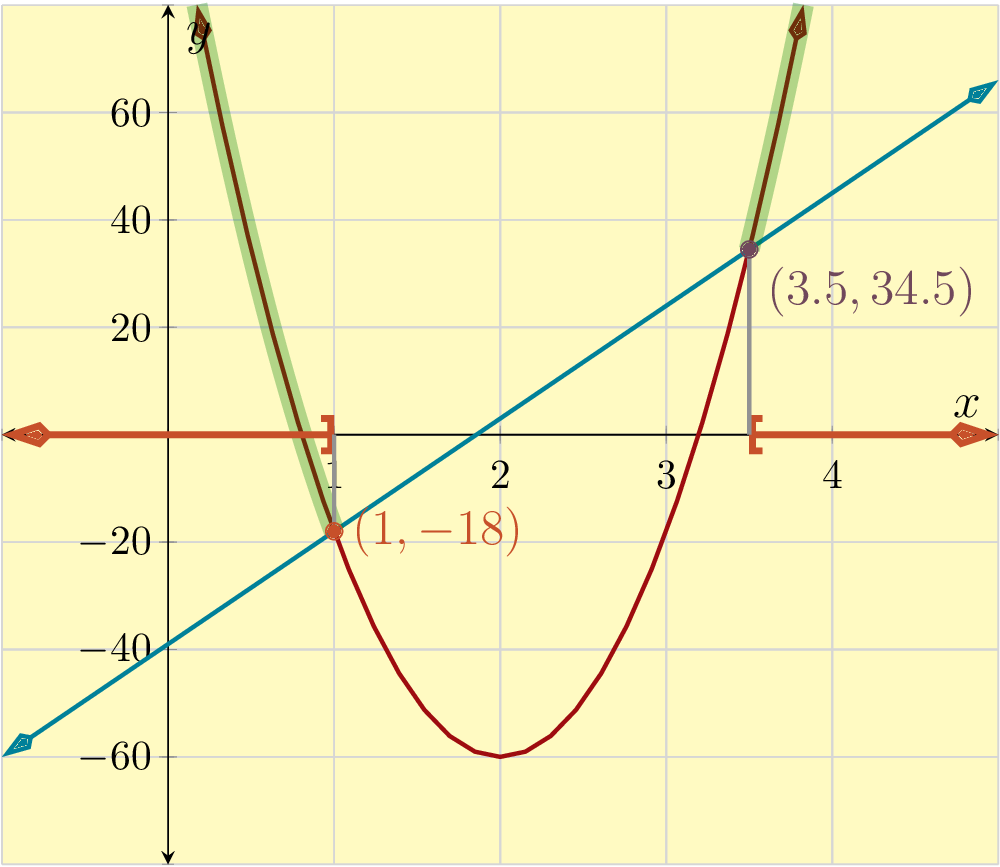
To solve \(42(x-2)^2-60 \ge 21x-39\text{,}\) we need to determine where the \(y\)-values of the parabola are higher than (or equal to) those of the line. This region is highlighted in Figure 13.7.18.
We can see that \(42(x-2)^2-60 \ge 21x-39\) for all values of \(x\) where \(x\le 1\) or \(x\ge 3.5\text{.}\) We can write this solution set in interval notation as \((-\infty,1]\cup[3.5,\infty)\) or in set-builder notation as \(\{x\mid x\le 1 \text{ or } x\ge 3.5\}\text{.}\)
-
To now solve \(42(x-2)^2-60 \lt 21x-39\text{,}\) we will need to determine where the \(y\)-values of the parabola are less than those of the line. This region is highlighted in Figure 13.7.19.
So the solutions to this inequality include all values of \(x\) for which \(1\lt x \lt 3.5\text{.}\) We can write this solution set in interval notation as \((1,3.5)\) or in set-builder notation as \(\{x \mid 1 \lt x \lt 3.5\}\text{.}\)


Subsection 13.7.3 Solving Compound Inequalities Graphically
Example 13.7.20.

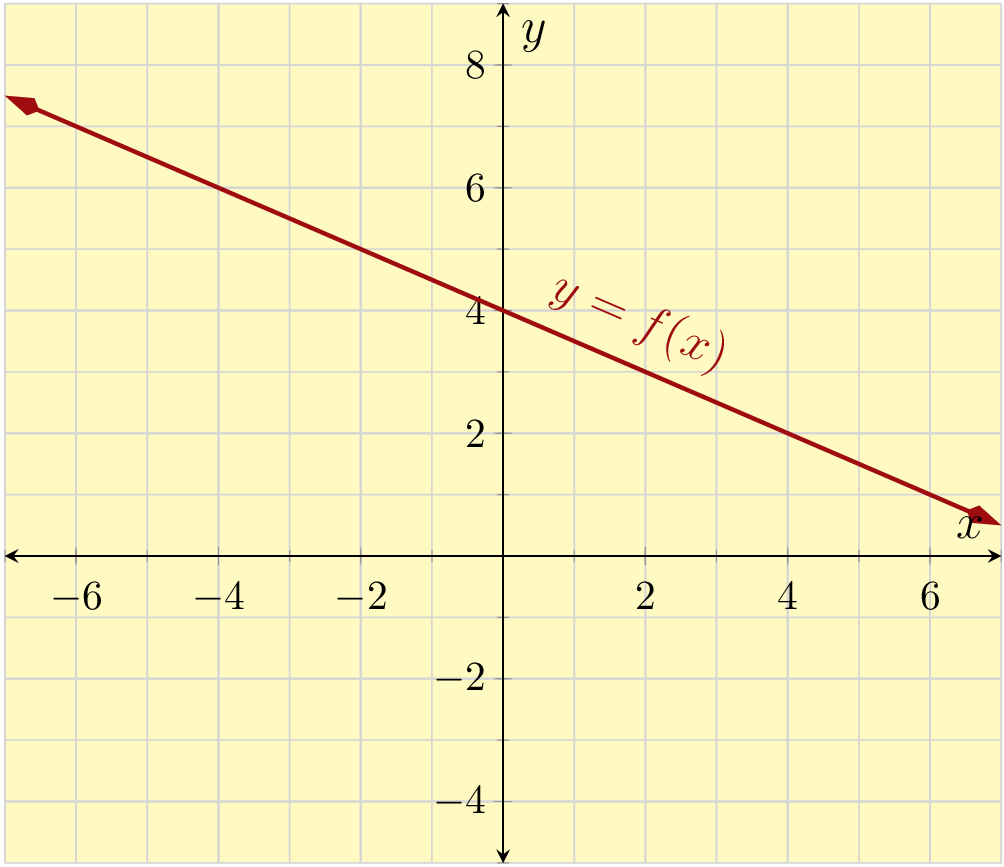
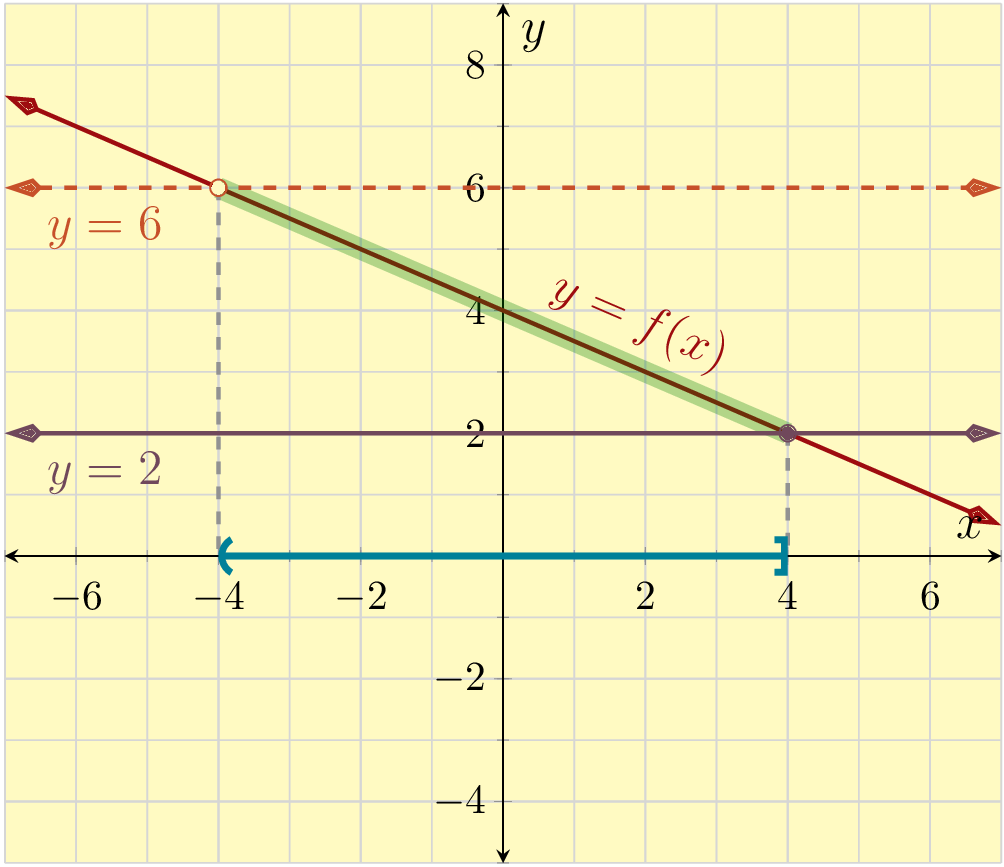
To solve the inequality \(2\le f(x) \lt 6\) means to find the \(x\)-values that give function values between \(2\) and \(6\text{,}\) not including \(6\text{.}\) We draw the horizontal lines \(y=2\) and \(y=6\text{.}\) Then we look for the points of intersection and find their \(x\)-values. We see that when \(x\) is between \(-4\) and \(4\text{,}\) not including \(-4\text{,}\) the inequality will be true. We have drawn the interval \((-4,4]\) along the \(x\)-axis, which is the solution set.

Example 13.7.23.
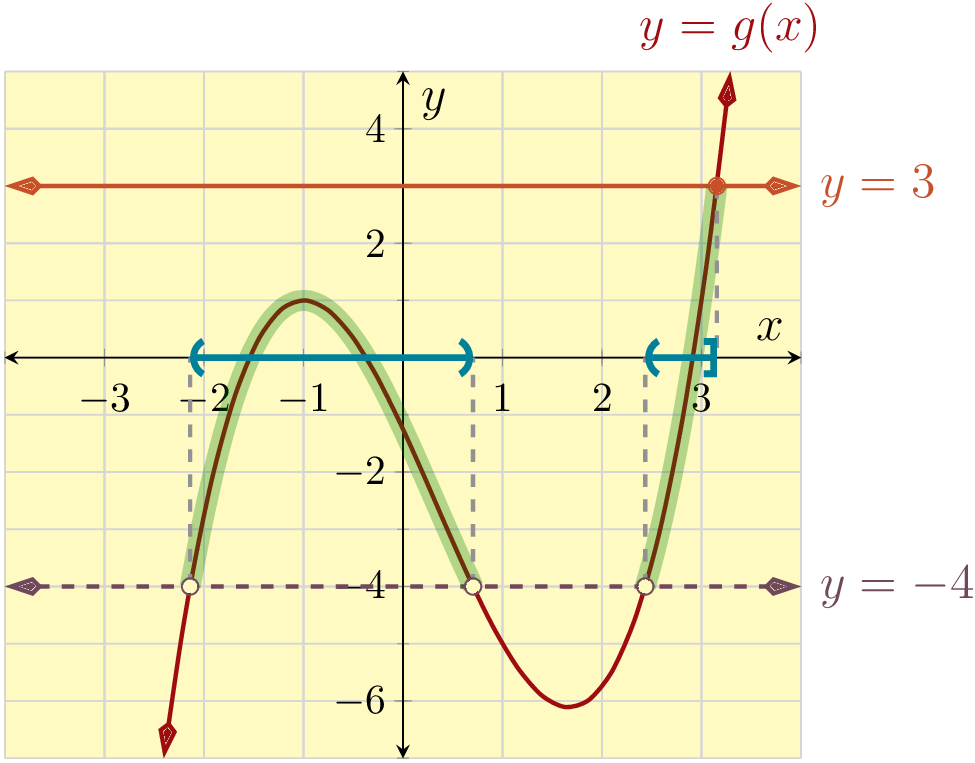
Figure 13.7.24 shows a graph of \(y=g(x)\text{.}\) Use the graph to solve the inequality \(-4\lt g(x) \le 3\text{.}\)

To solve \(-4\lt g(x) \le 3\text{,}\) we first draw the horizontal lines \(y=-4\) and \(y=3\text{.}\) To solve this inequality we notice that there are two pieces of the function \(g\) that are trapped between the \(y\)-values \(-4\) and \(3\text{.}\)
The solution set is the compound inequality \((-2.1,0.7)\cup(2.4,3.2]\text{.}\)

Example 13.7.26.
Phuong is taking the standard climbing route on Mount Hood from Timberline Lodge up the Southside Hogsback to the summit and back down the same way. Her altitude can be very closely modeled by an absolute value function since the angle of ascent is nearly constant. Let \(x\) represent the number of miles walked from Timberline Lodge, and let \(f(x)\) represent the altitude, in miles, after walking for a distance \(x\text{.}\) The altitude can be modeled by \(f\left(x\right)=2.1-0.3077\cdot\abs{x-3.25}\text{.}\) Note that below Timberline Lodge this model fails to be accurate.
Solve the equation \(f(x)=1.1\) graphically and interpret the results in the context of the problem.
Altitude sickness can occur at or above altitudes \(1.5\) miles. Set up and solve an inequality graphically to find out how far Phuong can walk the trail and still be under \(1.5\) miles of elevation.
-
First, we substitute the formula for \(f(x)\) and simplify the equation.
\begin{align*} f(x)\amp=1.1\\ 2.1-0.3077\cdot\abs{x-3.25} \amp=1.1 \end{align*}At this point, we should make a graph of both \(y=2.1-0.3077\cdot\abs{x-3.25}\) and \(y=1.1\) and find their intersections.
Next, we should note that we are looking for the \(x\)-values of the intersections. These solutions are \(0\) and \(6.5\text{.}\) According to the model, Phuong will be at \(1.1\) miles of elevation after walking about \(0\) miles as well as about \(6.5\) miles along the trail. This implies that Timberline Lodge is at \(1.1\) miles of elevation. In addition, it implies that the entire hike is \(6.5\) miles round trip, ending at Timberline Lodge again.
-
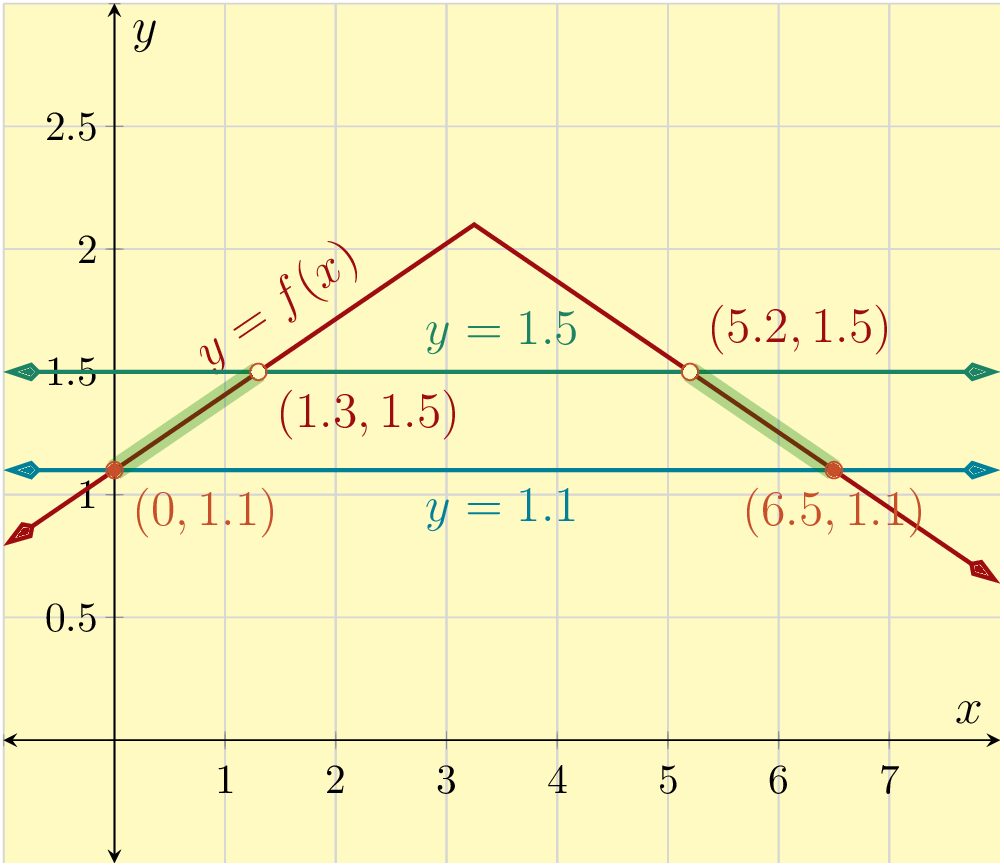
The inequality we are looking for will describe when the altitude is below \(1.5\) miles, but also above \(1.1\) miles based on the reality of the situation (since the model only works above Timberline lodge at \(1.1\) miles of altitude). Since \(f(x)\) is the altitude, the inequality we need is \(1.1\le f(x)\lt 1.5\text{,}\) which becomes \(1.1\le2.1-0.3077\cdot\abs{x-3.25}\lt 1.5\text{.}\)
Let's examine the graph again to solve this inequality: We are looking for places on the graph where the \(y\)-value is above \(1.1\text{,}\) but also where the graph is below \(1.5\text{.}\) To find this, we will draw in lines at both of those \(y\)-values and find intersections with \(f\text{.}\)
The highlighted portions of the graph have \(x\)-values that satisfy the inequalities \(0\le x\lt1.3 \text{ or } 5.2\lt x\le 6.5\text{.}\)
In conclusion, based both on our math and the reality of the situation, regions of the trail that are below \(1.5\) miles are those that are from Timberline Lodge (at \(0\) miles on the trail), to \(1.3\) miles along the trail and then also from \(5.2\) miles along the trail (and by now we are on our way back down) to \(6.5\) miles along the trail (back at Timberline Lodge). If we wanted to write this in interval notation, we might write \([0,1.3)\cup(5.2,6.5]\text{.}\) There is a big portion along the trail (from \(1.3\) miles to \(5.2\) miles) that Phuong will be above the \(1.5\) mile altitude and should watch for signs of altitude sickness.


Reading Questions 13.7.4 Reading Questions
1.
The graph of the function \(f\) is above the graph of the function \(g\) between \(x=6\) and \(x=9\text{.}\) How many solutions does the inequality \(f(x)\gt g(x)\) have?
2.
Can the solution set to the inequality \(h(x)\gt k(x)\) be the set of all real numbers? Why or why not?
3.
Can the solution set to the inequality \(h(x)\gt k(x)\) be the empty set (i.e., the inequality has no solutions)? Why or why not?
Exercises 13.7.5 Exercises
Review and Warmup
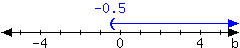
1.
For the interval expressed in the number line, write it using set-builder notation and interval notation.
In set-builder notation:
In interval notation:
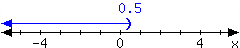
2.
For the interval expressed in the number line, write it using set-builder notation and interval notation.
In set-builder notation:
In interval notation:
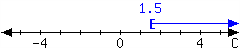
3.
For the interval expressed in the number line, write it using set-builder notation and interval notation.
In set-builder notation:
In interval notation:
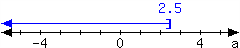
4.
For the interval expressed in the number line, write it using set-builder notation and interval notation.
In set-builder notation:
In interval notation:
5.
For the function \(L\) defined by
use technology to determine the following. Round answers as necessary.
Any intercepts.
The vertex.
The domain.
The range.
6.
For the function \(M\) defined by
use technology to determine the following. Round answers as necessary.
Any intercepts.
The vertex.
The domain.
The range.
7.
For the function \(N\) defined by
use technology to determine the following. Round answers as necessary.
Any intercepts.
The vertex.
The domain.
The range.
8.
For the function \(B\) defined by
use technology to determine the following. Round answers as necessary.
Any intercepts.
The vertex.
The domain.
The range.
Solving Inequalities Graphically
9.
Solve the equations and inequalities graphically. Use interval notation when applicable.
\(\abs{\frac{2}{3}x+2}=4\)
\(\abs{\frac{2}{3}x+2}\gt 4\)
\(\abs{\frac{2}{3}x+2}\le 4\)
10.
Solve the equations and inequalities graphically. Use interval notation when applicable.
\(\abs{\frac{11-2x}{5}}=4\)
\(\abs{\frac{11-2x}{5}}\gt 4\)
\(\abs{\frac{11-2x}{5}}\le 4\)
11.
Solve the equations and inequalities graphically. Use interval notation when applicable.
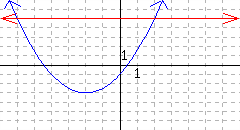
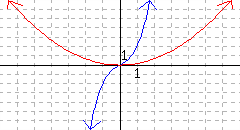
\(x^2-3=1\)
\(x^2-3\gt1\)
\(x^2-3\le1\)
12.
Solve the equations and inequalities graphically. Use interval notation when applicable.
\(x^2-x-3=x\)
\(x^2-x-3\gt x\)
\(x^2-x-3\le x\)
13.
The equations \(y={\frac{1}{2}x^{2}+2x-1}\) and \(y={5}\) are plotted.
What are the points of intersection?
Solve \({\frac{1}{2}x^{2}+2x-1}={5}\text{.}\)
Solve \({\frac{1}{2}x^{2}+2x-1}\gt{5}\text{.}\)
14.
The equations \(y={\frac{1}{3}x^{2}-3x+3}\) and \(y={-3}\) are plotted.
What are the points of intersection?
Solve \({\frac{1}{3}x^{2}-3x+3}={-3}\text{.}\)
Solve \({\frac{1}{3}x^{2}-3x+3}\gt{-3}\text{.}\)
15.
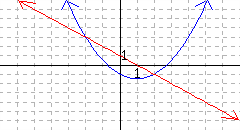
The equations \(y={-x^{2}+1.5x+5}\) and \(y={-5}\) are plotted.
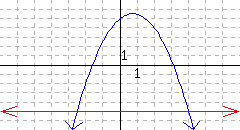
What are the points of intersection?
Solve \({-x^{2}+1.5x+5}={-5}\text{.}\)
Solve \({-x^{2}+1.5x+5}\gt{-5}\text{.}\)
16.
The equations \(y={-x^{2}-3.5x+2}\) and \(y={2}\) are plotted.
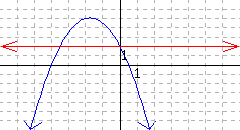
What are the points of intersection?
Solve \({-x^{2}-3.5x+2}={2}\text{.}\)
Solve \({-x^{2}-3.5x+2}\gt{2}\text{.}\)
17.
The equations \(y={\frac{1}{2}x^{2}-x-1}\) and \(y={-x+1}\) are plotted.
What are the points of intersection?
Solve \({\frac{1}{2}x^{2}-x-1}={-x+1}\text{.}\)
Solve \({\frac{1}{2}x^{2}-x-1}\gt{-x+1}\text{.}\)
18.
The equations \(y={\frac{-1}{3}x^{2}+2x+3}\) and \(y={x-3}\) are plotted.
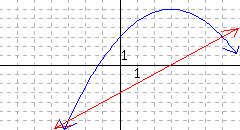
What are the points of intersection?
Solve \({\frac{-1}{3}x^{2}+2x+3}={x-3}\text{.}\)
Solve \({\frac{-1}{3}x^{2}+2x+3}\gt{x-3}\text{.}\)
19.
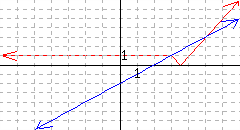
The equations \(y={\frac{1}{4}x^{3}}\) and \(y={x}\) are plotted.
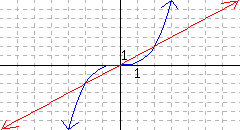
What are the points of intersection?
Solve \({\frac{1}{4}x^{3}}={x}\text{.}\)
Solve \({\frac{1}{4}x^{3}}\gt{x}\text{.}\)
20.
The equations \(y={x^{3}+x}\) and \(y={\frac{1}{6}x^{2}}\) are plotted.
What are the points of intersection?
Solve \({x^{3}+x}={\frac{1}{6}x^{2}}\text{.}\)
Solve \({x^{3}+x}\gt{\frac{1}{6}x^{2}}\text{.}\)
21.
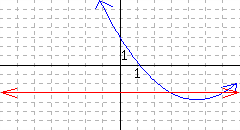
The equations \(y={\sqrt{x+4}}\) and \(y={\frac{4x^{2}+x+3}{36}}\) are plotted.
What are the points of intersection?
Solve \({\sqrt{x+4}}={\frac{4x^{2}+x+3}{36}}\text{.}\)
Solve \({\sqrt{x+4}}\gt{\frac{4x^{2}+x+3}{36}}\text{.}\)
22.
The equations \(y={\sqrt{4-x}}\) and \(y={-2-x}\) are plotted.

What are the points of intersection?
Solve \({\sqrt{4-x}}={-2-x}\text{.}\)
Solve \({\sqrt{4-x}}\gt{-2-x}\text{.}\)
23.
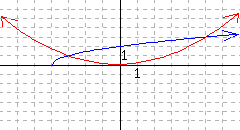
The equations \(y={\frac{1}{2}x^{2}+2x}\) and \(y={\sqrt[3]{9-2x^{2}}+\frac{23}{50}x-\frac{52}{25}}\) are plotted.
What are the points of intersection?
Solve \({\frac{1}{2}x^{2}+2x}={\sqrt[3]{9-2x^{2}}+\frac{23}{50}x-\frac{52}{25}}\text{.}\)
Solve \({\frac{1}{2}x^{2}+2x}\gt{\sqrt[3]{9-2x^{2}}+\frac{23}{50}x-\frac{52}{25}}\text{.}\)
24.
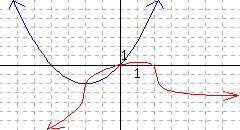
The equations \(y={x-2}\) and \(y={\left|x+\left|x-3\right|-4\right|}\) are plotted.
What are the points of intersection?
Solve \({x-2}={\left|x+\left|x-3\right|-4\right|}\text{.}\)
Solve \({x-2}\gt{\left|x+\left|x-3\right|-4\right|}\text{.}\)
Solving Equations and Inequalities Graphically Using Technology
25.
Let \(s(x)=\frac{1}{5}x^2-2x+10\) and \(t(x)=-x+40\text{.}\) Use graphing technology to determine the following.
What are the points of intersection for these two functions?
Solve \(s(x)=t(x)\text{.}\)
Solve \(s(x)\gt t(x)\text{.}\)
Solve \(s(x)\leq t(x)\text{.}\)
26.
Let \(w(x)=\frac{1}{4}x^2-3x-8\) and \(m(x)=x+12\text{.}\) Use graphing technology to determine the following.
What are the points of intersection for these two functions?
Solve \(w(x)=m(x)\text{.}\)
Solve \(w(x)\gt m(x)\text{.}\)
Solve \(w(x)\leq m(x)\text{.}\)
27.
Let \(f(x)=4x^2+5x-1\) and \(g(x)=5\text{.}\) Use graphing technology to determine the following.
What are the points of intersection for these two functions?
Solve \(f(x)=g(x)\text{.}\)
Solve \(f(x)\lt g(x)\text{.}\)
Solve \(f(x)\geq g(x)\text{.}\)
28.
Let \(p(x)=6x^2-3x+4\) and \(k(x)=7\text{.}\) Use graphing technology to determine the following.
What are the points of intersection for these two functions?
Solve \(p(x)=k(x)\text{.}\)
Solve \(p(x)\lt k(x)\text{.}\)
Solve \(p(x)\geq k(x)\text{.}\)
29.
Let \(q(x)=-4x^2-24x+10\) and \(r(x)=2x+22\text{.}\) Use graphing technology to determine the following.
What are the points of intersection for these two functions?
Solve \(q(x)=r(x)\text{.}\)
Solve \(q(x)\gt r(x)\text{.}\)
Solve \(q(x)\leq r(x)\text{.}\)
30.
Let \(h(x)=-10x^2-5x+3\) and \(j(x)=-3x-9\text{.}\) Use graphing technology to determine the following.
What are the points of intersection for these two functions?
Solve \(h(x)=j(x)\text{.}\)
Solve \(h(x)\gt j(x)\text{.}\)
Solve \(h(x)\leq j(x)\text{.}\)
31.
Use graphing technology to solve the equation \((200+5x)(100-2x)=15000\text{.}\) Approximate the solution(s) if necessary.
32.
Use graphing technology to solve the inequality \(2x^2+5x-3\gt -5\text{.}\) State the solution set using interval notation, and approximate if necessary.
33.
Use graphing technology to solve the inequality \(-x^2+4x-7 \gt -12\text{.}\) State the solution set using interval notation, and approximate if necessary.
34.
Use graphing technology to solve the inequality \(10x^2-11x+7\leq7\text{.}\) State the solution set using interval notation, and approximate if necessary.
35.
Use graphing technology to solve the inequality \(-10x^2-15x+4\leq 9\text{.}\) State the solution set using interval notation, and approximate if necessary.
36.
Use graphing technology to solve the inequality \(-x^2-6x+1>x+5\text{.}\) State the solution set using interval notation, and approximate if necessary.
37.
Use graphing technology to solve the inequality \(3x^2+5x-4>-2x+1\text{.}\) State the solution set using interval notation, and approximate if necessary.
38.
Use graphing technology to solve the inequality \(-10x+4\leq 20x^2-34x+6\text{.}\) State the solution set using interval notation, and approximate if necessary.
39.
Use graphing technology to solve the inequality \(-15x^2-6\leq 10x-4\text{.}\) State the solution set using interval notation, and approximate if necessary.
40.
Use graphing technology to solve the inequality \(\frac{1}{2}x^2+\frac{3}{2}x \geq \frac{1}{2}x-\frac{3}{2}\text{.}\) State the solution set using interval notation, and approximate if necessary.
41.
Use graphing technology to solve the inequality \(\frac{3}{4}x\geq \frac{1}{4}x^2-3x\text{.}\) State the solution set using interval notation, and approximate if necessary.