
Section 9.5 Topics in Graphing Chapter Review
¶Subsection 9.5.1 Review of Graphing
In Section 9.1, we reviewed the fundamentals of graph-making. In particular, given an equation of the form \(y=\text{expression in }x\text{,}\) the fundamental approach to making a graph is to make a table of points to plot.
We also looked back at the notions of “intercepts” on a graph. In the case of a linear equation in \(x\) and \(y\text{,}\) finding the \(x\)- and \(y\)-intercepts can be a way to create a graph.
Subsection 9.5.2 Key Features of Quadratic Graphs
In Section 9.2, we identified the key features of a quadratic graph (which takes the shape of a parabola). The key features are the direction that it opens, the vertex, the axis of symmetry, the vertical intercept, and the horizontal intercepts (if there are any).
If the equation for a quadratic curve is \(y=ax^2+bx+c\text{,}\) then the formula \(h=-\frac{b}{2a}\) gives the first coordinate of the vertex. So you can find the location of the vertex with that coordinate and subbing that number into the equation to find the second coordinate.
If we know the location of a parabola's vertex and the direction that it opens, we can sketch the parabola. It helps to make a table finding a few points the the left and to the right of the vertex. The symmetry of a parabola means you only need to find points on one side to automatically get corresponding points on the other side.
Subsection 9.5.3 Graphing Quadratic Equations
In Section 9.3, we practiced finding the exact locations of the vertical and horizontal intercepts for a quadratic equation curve. The vertical intercept can be found by lettting \(x=0\text{.}\) The result is a number on the \(y\)-axis.
The horizontal intercepts can be found by setting \(y\) equal to \(0\text{.}\) This leaves you with a quadratic equation in one variable, \(x\text{,}\) and the quadratic formula can be used to solve for \(x\text{.}\) There might be no solutions, as is the case when the parabola doesn't touch the \(x\)-axis. There might be one solution, when the vertex is on the \(x\)-axis. Or there might be two solutions, and therefore two horizontal intercepts.
When we know the exact locations of the intercepts (as well as the location of the vertex as found in Section 9.2) then we can plot accurate graphs of quadratic equations.
Subsection 9.5.4 Graphically Solving Equations and Inequalities
In Section 9.4, we see how a graph can be used to solve an equation or inequality. Each side of an equation gives you a curve, and where the two curves cross tells you where there are solutions to the equation.
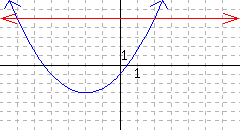
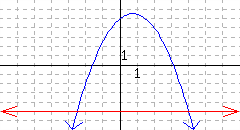
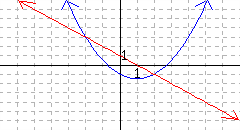
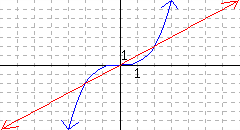
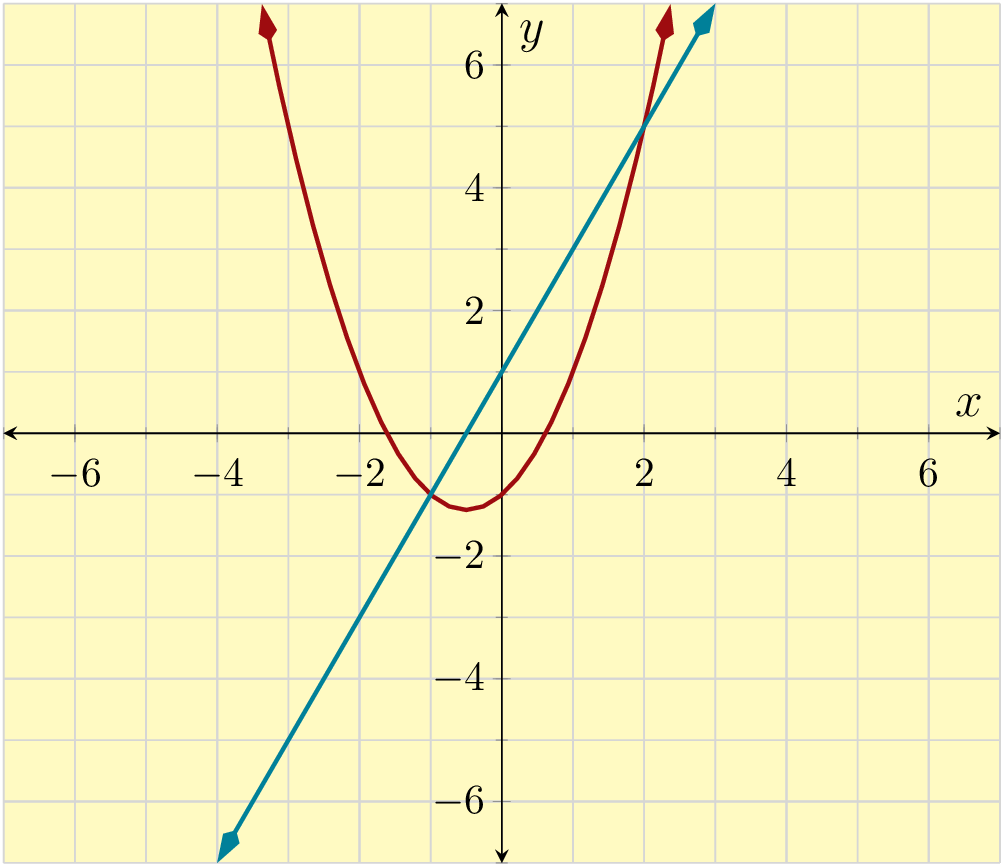
For example, to solve the equation \(x^2+x-1=2x+1\text{,}\) we could plot two curves: \(y=x^2+x-1\) and \(y=2x+1\text{.}\) We might use a computer to make the graphs for us, as in Figure 9.5.1.

Since the curves cross at \((-1,-1)\) and \((2,5)\text{,}\) the solutions are \(x=-1\) and \(x=2\text{.}\) This means the solution set is \(\{-1,2\}\text{.}\)
Exercises 9.5.5 Exercises
Review of Graphing
1.
Make a table for the equation.
| \(x\) | \(y=-9x\) |
2.
Make a table for the equation.
| \(x\) | \(y=-3x+5\) |
3.
Make a table for the equation.
| \(x\) | \(y={\frac{10}{3}}x+1\) |
4.
Make a table for the equation.
| \(x\) | \(y=-{\frac{5}{4}}x+3\) |
5.
Create a table of ordered pairs and then make a plot of the equation \(y=2x+3\text{.}\)
6.
Create a table of ordered pairs and then make a plot of the equation \(y=-\frac{3}{4}x+2\text{.}\)
7.
Find the \(y\)-intercept and \(x\)-intercept of the line given by the equation. If a particular intercept does not exist, enter none into all the answer blanks for that row.
| \(x\)-value | \(y\)-value | Location (as an ordered pair) | |
| \(y\)-intercept | |||
| \(x\)-intercept |
8.
Find the \(y\)-intercept and \(x\)-intercept of the line given by the equation. If a particular intercept does not exist, enter none into all the answer blanks for that row.
| \(x\)-value | \(y\)-value | Location (as an ordered pair) | |
| \(y\)-intercept | |||
| \(x\)-intercept |
9.
Find the \(x\)- and \(y\)-intercepts of the line with equation \(5x-6y=-90\text{.}\) Then find one other point on the line. Use your results to graph the line.
10.
Find the \(x\)- and \(y\)-intercepts of the line with equation \(x+5y=-15\text{.}\) Then find one other point on the line. Use your results to graph the line.
Key Features of Quadratic Graphs
11.
Find the axis of symmetry and vertex of the quadratic function.
\({y}={5x^{2}-50x+3}\)
Axis of symmetry:
Vertex:
12.
Find the axis of symmetry and vertex of the quadratic function.
\({y}={-3-30x-5x^{2}}\)
Axis of symmetry:
Vertex:
13.
Find the axis of symmetry and vertex of the quadratic function.
\({y}={-1-x^{2}+6x}\)
Axis of symmetry:
Vertex:
14.
Find the axis of symmetry and vertex of the quadratic function.
\({y}={-2x^{2}+20x}\)
Axis of symmetry:
Vertex:
15.
Find the axis of symmetry and vertex of the quadratic function.
\({y}={2-x^{2}}\)
Axis of symmetry:
Vertex:
16.
Find the axis of symmetry and vertex of the quadratic function.
\({y}={-2x^{2}-10x+4}\)
Axis of symmetry:
Vertex:
17.
Find the axis of symmetry and vertex of the quadratic function.
\({y}={2x^{2}+10x-2}\)
Axis of symmetry:
Vertex:
18.
Find the axis of symmetry and vertex of the quadratic function.
\({y}={3x^{2}}\)
Axis of symmetry:
Vertex:
19.
Find the axis of symmetry and vertex of the quadratic function.
\({y}={0.4x^{2}-4}\)
Axis of symmetry:
Vertex:
20.
Find the axis of symmetry and vertex of the quadratic function.
\({y}={5\!\left(x+3\right)^{2}+4}\)
Axis of symmetry:
Vertex:
For the given quadratic equation, find the vertex. Then create a table of ordered pairs centered around the vertex and make a graph.
21.
\(y=x^2+2\)
22.
\(y=x^2-5\)
23.
\(y=(x-2)^2\)
24.
\(y=(x+3)^2\)
25.
For \(y=4x^2-8x+5\text{,}\) determine the vertex, create a table of ordered pairs, and then make a graph.
26.
For \(y=-x^2+4x+2\text{,}\) determine the vertex, create a table of ordered pairs, and then make a graph.
27.
For \(y=x^2-5x+3\text{,}\) determine the vertex, create a table of ordered pairs, and then make a graph.
28.
For \(y=-2x^2-5x+6\text{,}\) determine the vertex, create a table of ordered pairs, and then make a graph.
29.
Consider two numbers where one number is \(4\) less than a second number. Find a pair of such numbers that has the least product possible. One approach is to let \(x\) represent the smaller number, and write a formula for a function of \(x\) that outputs the product of the two numbers. Then find its vertex and interpret it.
These two numbers are and the least possible product is .
30.
You will build a rectangular sheep enclosure next to a river. There is no need to build a fence along the river, so you only need to build on three sides. You have a total of \(420\) feet of fence to use. Find the dimensions of the pen such that you can enclose the maximum possible area. One approach is to let \(x\) represent the length of fencing that runs perpendicular to the river, and write a formula for a function of \(x\) that outputs the area of the enclosure. Then find its vertex and interpret it.
The length of the pen (parallel to the river) should be , the width (perpendicular to the river) should be , and the maximum possible area is .
Graphing Quadratic Equations
31.
Find the \(y\)-intercept and any \(x\)-intercept(s) of the quadratic curve.
\({y}={x^{2}-2x-8}\)
\(y\)-intercept:
\(x\)-intercept(s):
32.
Find the \(y\)-intercept and any \(x\)-intercept(s) of the quadratic curve.
\({y}={-x^{2}+1}\)
\(y\)-intercept:
\(x\)-intercept(s):
33.
Find the \(y\)-intercept and any \(x\)-intercept(s) of the quadratic curve.
\({y}={x^{2}+6x+9}\)
\(y\)-intercept:
\(x\)-intercept(s):
34.
Find the \(y\)-intercept and any \(x\)-intercept(s) of the quadratic curve.
\({y}={x^{2}+4x+7}\)
\(y\)-intercept:
\(x\)-intercept(s):
35.
Find the \(y\)-intercept and any \(x\)-intercept(s) of the quadratic curve.
\({y}={x^{2}+8x+5}\)
\(y\)-intercept:
\(x\)-intercept(s):
36.
Find the \(y\)-intercept and any \(x\)-intercept(s) of the quadratic curve.
\({y}={5x^{2}-8x-4}\)
\(y\)-intercept:
\(x\)-intercept(s):
37.
Find the \(y\)-intercept and any \(x\)-intercept(s) of the quadratic curve.
\({y}={-x+18-5x^{2}}\)
\(y\)-intercept:
\(x\)-intercept(s):
38.
Find the \(y\)-intercept and any \(x\)-intercept(s) of the quadratic curve.
\({y}={5x-2x^{2}}\)
\(y\)-intercept:
\(x\)-intercept(s):
Graph each curve by algebraically determining its key features.
39.
\(y=x^2-7x+12\)
40.
\(y=-x^2-x+20\)
41.
\(y=x^2-8x+16\)
42.
\(y=x^2-4\)
43.
\(y=x^2+6x\)
44.
\(y=-x^2+5x\)
45.
\(y=x^2+4x+7\)
46.
\(y=x^2+2x-5\)
47.
\(y=-x^2+4x-1\)
48.
\(y=2x^2-4x-30\)
49.
An object was shot up into the air with an initial vertical speed of \(384\) feet per second. Its height as time passes can be modeled by the quadratic equation \(y={-16t^{2}+384t}\text{.}\) Here \(t\) represents the number of seconds since the object’s release, and \(y\) represents the object’s height in feet.
After , this object reached its maximum height of .
This object flew for before it landed on the ground.
This object was in the air \({3\ {\rm s}}\) after its release.
This object was \({704\ {\rm ft}}\) high at two times: once after its release, and again later after its release.
50.
A remote control aircraft will perform a stunt by flying toward the ground and then up. Its height, in feet, can be modeled by the equation \(h={t^{2}-10t+28}\text{,}\) where \(t\) is in seconds. The plane
will
will not
51.
An object is launched upward at the height of \(280\) meters. Its height can be modeled by
where \(h\) stands for the object’s height in meters, and \(t\) stands for time passed in seconds since its launch. The object’s height will be \(330\) meters twice before it hits the ground. Find how many seconds since the launch would the object’s height be \(330\) meters. Round your answers to two decimal places if needed.
The object’s height would be \(330\) meters the first time at seconds, and then the second time at seconds.
52.
Currently, an artist can sell \(230\) paintings every year at the price of \({\$70.00}\) per painting. Each time he raises the price per painting by \({\$10.00}\text{,}\) he sells \(10\) fewer paintings every year.
Assume he will raise the price per painting \(x\) times, then he will sell \(230-10x\) paintings every year at the price of \(70+10x\) dollars. His yearly income can be modeled by the equation:
where \(i\) stands for his yearly income in dollars. If the artist wants to earn \({\$21{,}600.00}\) per year from selling paintings, what new price should he set?
To earn \({\$21{,}600.00}\) per year, the artist could sell his paintings at two different prices. The lower price is per painting, and the higher price is per painting.
Graphically Solving Equations and Inequalities
53.
Use technology to make some graphs and determine how many times the graphs of the following curves cross each other.
\(y={\left(286+5x\right)\!\left(78+10x\right)}\) and \(y={6000}\) intersect
zero times
one time
two times
three times
54.
Use technology to make some graphs and determine how many times the graphs of the following curves cross each other.
\(y={5x^{3}-x^{2}-6x}\) and \(y={-4x+3}\) intersect
zero times
one time
two times
three times
55.
Use technology to make some graphs and determine how many times the graphs of the following curves cross each other.
\(y={0.2\!\left(8x^{2}+2\right)}\) and \(y={0.2\!\left(x-9\right)}\) intersect
zero times
one time
two times
three times
56.
Use technology to make some graphs and determine how many times the graphs of the following curves cross each other.
\(y={1.85\!\left(x-4\right)^{2}-8.4}\) and \(y={x+1}\) intersect
zero times
one time
two times
three times
57.
The equations \(y={\frac{1}{2}x^{2}+2x-1}\) and \(y={5}\) are plotted.
What are the points of intersection?
Solve \({\frac{1}{2}x^{2}+2x-1}={5}\text{.}\)
Solve \({\frac{1}{2}x^{2}+2x-1}\gt{5}\text{.}\)
58.
The equations \(y={-x^{2}+1.5x+5}\) and \(y={-5}\) are plotted.
What are the points of intersection?
Solve \({-x^{2}+1.5x+5}={-5}\text{.}\)
Solve \({-x^{2}+1.5x+5}\gt{-5}\text{.}\)
59.
The equations \(y={\frac{1}{2}x^{2}-x-1}\) and \(y={-x+1}\) are plotted.
What are the points of intersection?
Solve \({\frac{1}{2}x^{2}-x-1}={-x+1}\text{.}\)
Solve \({\frac{1}{2}x^{2}-x-1}\gt{-x+1}\text{.}\)
60.
The equations \(y={\frac{1}{4}x^{3}}\) and \(y={x}\) are plotted.
What are the points of intersection?
Solve \({\frac{1}{4}x^{3}}={x}\text{.}\)
Solve \({\frac{1}{4}x^{3}}\gt{x}\text{.}\)
61.
The equations \(y={\sqrt{x+4}}\) and \(y={\frac{4x^{2}+x+3}{36}}\) are plotted.
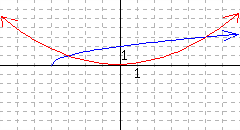
What are the points of intersection?
Solve \({\sqrt{x+4}}={\frac{4x^{2}+x+3}{36}}\text{.}\)
Solve \({\sqrt{x+4}}\gt{\frac{4x^{2}+x+3}{36}}\text{.}\)
62.
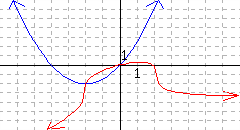
The equations \(y={\frac{1}{2}x^{2}+2x}\) and \(y={\sqrt[3]{9-2x^{2}}+\frac{23}{50}x-\frac{52}{25}}\) are plotted.
What are the points of intersection?
Solve \({\frac{1}{2}x^{2}+2x}={\sqrt[3]{9-2x^{2}}+\frac{23}{50}x-\frac{52}{25}}\text{.}\)
Solve \({\frac{1}{2}x^{2}+2x}\gt{\sqrt[3]{9-2x^{2}}+\frac{23}{50}x-\frac{52}{25}}\text{.}\)