Definition 9.2.2
A quadratic function has the form \(f(x)=ax^2+bx+c\) where \(a, b\text{,}\) and \(c\) are real numbers, and \(a \neq 0\text{.}\) The graph of a quadratic function has the shape of a parabola.
In this section we will learn about quadratic functions and how to identify their key features on a graph. We will identify their direction, vertex, axis of symmetry and intercepts. We will also see how to graph a parabola by finding the vertex and making a table of function values. We will look at applications that involve the vertex of a quadratic function.
A quadratic function has the form \(f(x)=ax^2+bx+c\) where \(a, b\text{,}\) and \(c\) are real numbers, and \(a \neq 0\text{.}\) The graph of a quadratic function has the shape of a parabola.
Notice that a quadratic function has a squared term that linear functions do not have. If \(a=0,\) the function is linear. To understand the shape and features of a quadratic function, let's look at an example.
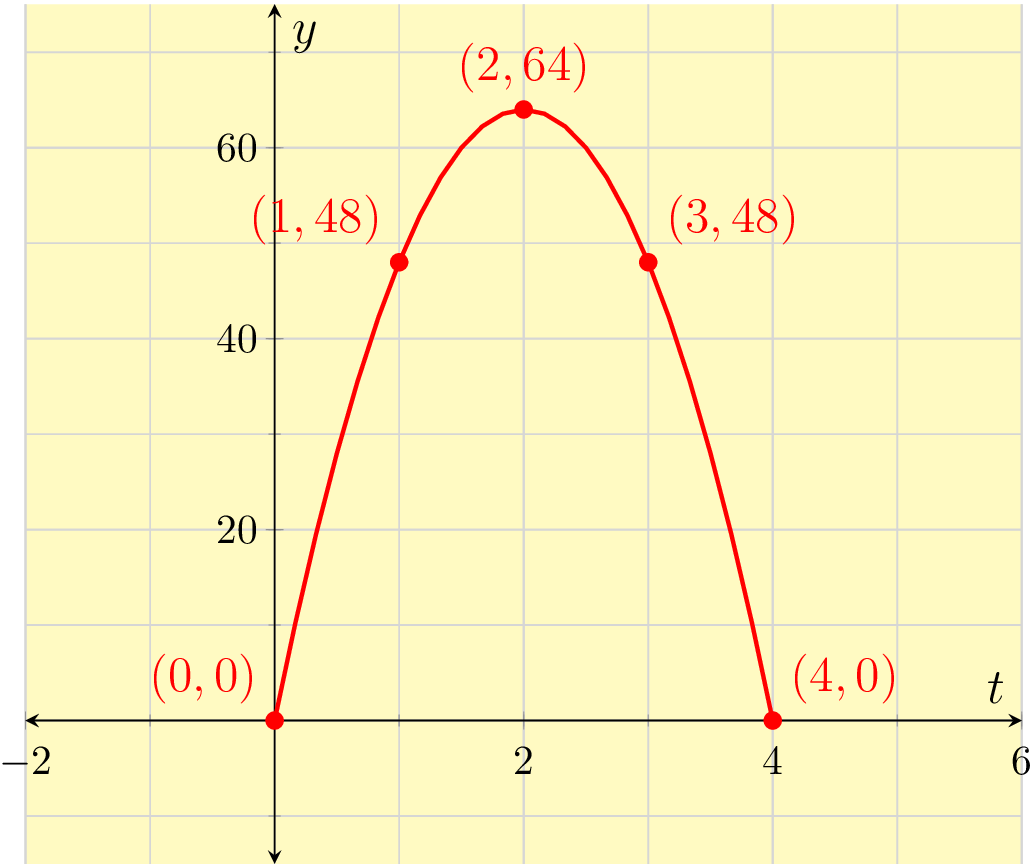
Hannah fired a toy rocket from the ground, which flew into the air at a speed of 64 feet per second. The path of the rocket can be modeled by the function \(f\) where \(f(t)=-16t^2+64t\text{.}\) To see the shape of the function we will make a table of values and plot the points. For the table we we will choose some values for \(t\) and then evaluate the function at each \(t\)-value:
| \(t\) | \(f(t)=-16t^2+64t\) | Point |
| \(0\) | \(f(0)=-16(0)^2+64(0)=0\) | \((0,0)\) |
| \(1\) | \(f(1)=-16(1)^2+64(1)=48\) | \((1,48)\) |
| \(2\) | \(f(2)=-16(2)^2+64(2)=64\) | \((2,64)\) |
| \(3\) | \(f(3)=-16(3)^2+64(3)=48\) | \((3,48)\) |
| \(4\) | \(f(4)=-16(4)^2+64(4)=0\) | \((4,0)\) |
Now that we have Table 9.2.3 and Figure 9.2.4, we can see the features of this parabola. Notice the symmetry in the shape of the graph and the \(y\)-values in the table. Consecutive \(y\)-values do not increase by a constant amount in the way that linear functions do.
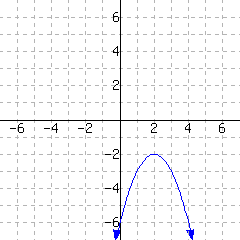
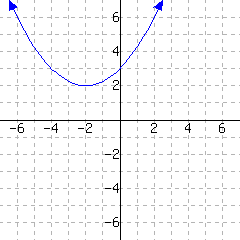
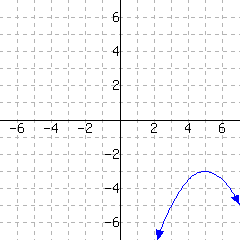
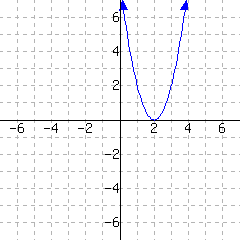
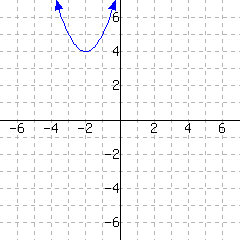
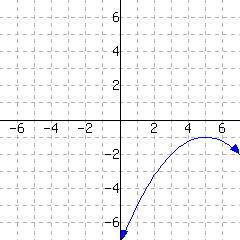
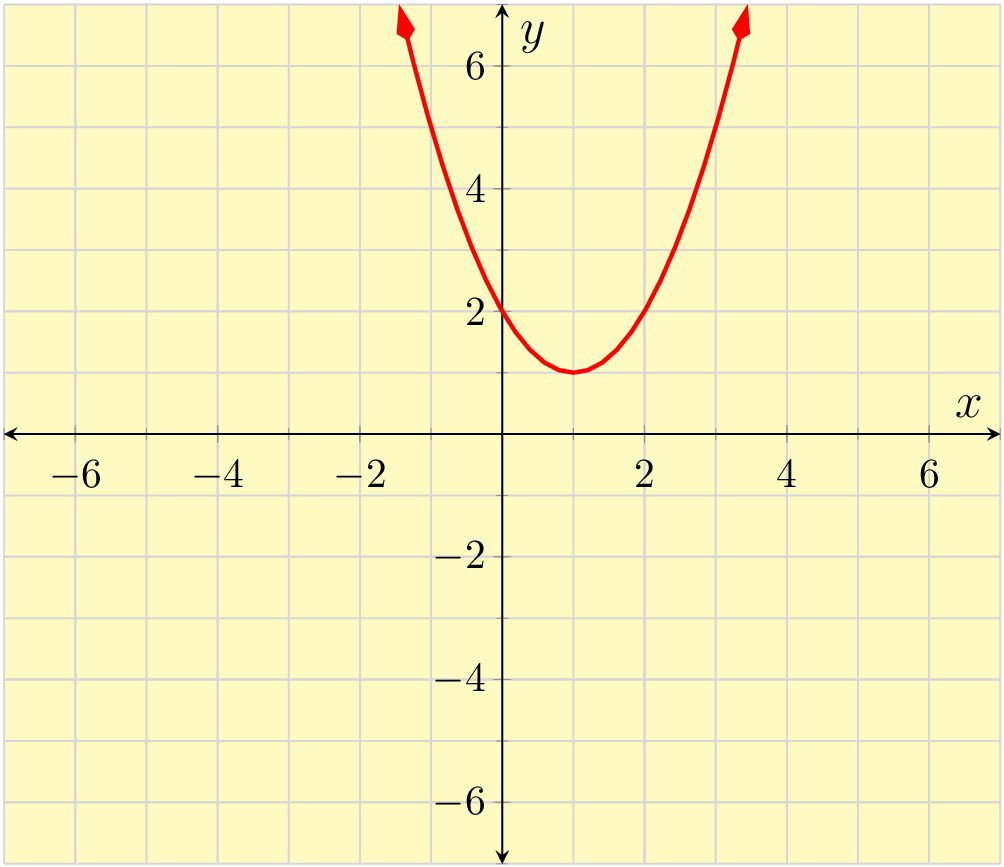
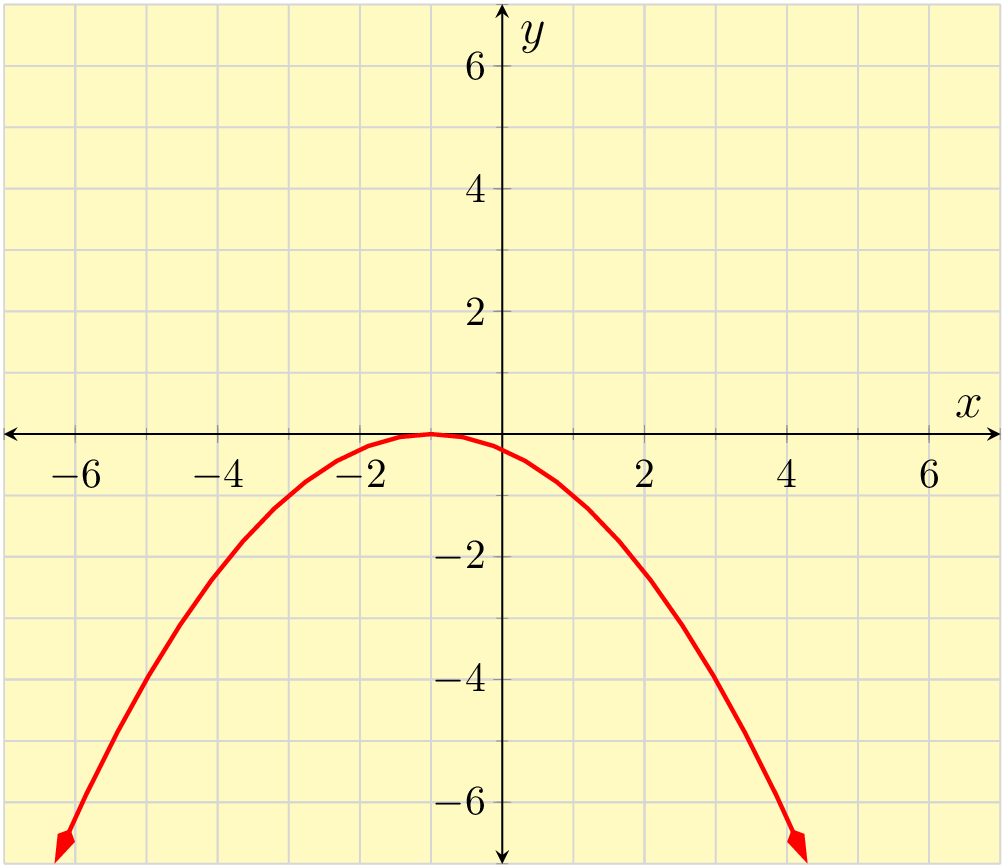
The first feature that we will talk about is the direction that a parabola opens. All parabolas open either upward or downward. This parabola in the rocket example opens downward because \(a\) is negative. Here are some more quadratic functions graphed so we can see which way they open.
We only need to look at the sign of the leading coefficient to determine which way the graph opens. If the leading coefficient is positive, the parabola opens upward. If the leading coefficient is negative, the parabola opens downward.
The vertex is the highest or lowest point on the graph. In Figure 9.2.4, the vertex is \((2,64)\text{.}\) This tells us that Hannah's rocket reached its maximum height of \(64\) feet after \(2\) seconds. If the parabola opens downward, as in the rocket example, then the \(y\)-value of the vertex is the maximum \(y\)-value. If the parabola opens upward then the \(y\)-value of the vertex is the minimum \(y\)-value.
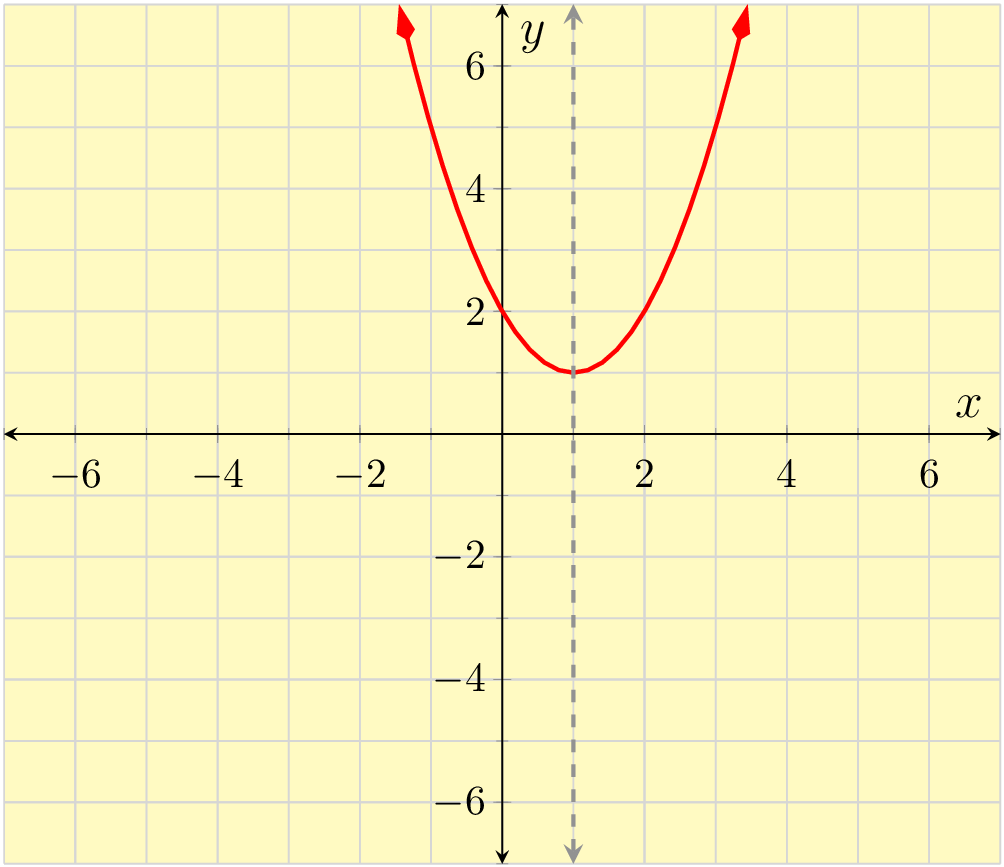
The axis of symmetry is a vertical line that passes through the vertex, dividing it in half. The vertex is the only point that does not have a symmetric point. We write the axis of symmetry as an equation of a vertical line so it always starts with "\(x=\text{.}\)" In Figure 9.2.4, the equation for the axis of symmetry is \(x=2\text{.}\)
The vertical intercept is the point where the parabola crosses the vertical axis. The vertical intercept is the \(y\)-intercept if the axes are labeled \(x\) and \(y\text{.}\) In Figure 9.2.4, the point \((0,0)\) is the starting point of the rocket. The \(y\)-value of \(0\) means the rocket started on the ground.
The horizontal intercept(s) are the points where the parabola crosses the horizontal axis. They are the \(x\)-intercepts if the axes are labeled \(x\) and \(y\text{.}\) The point \((0,0)\) on the path of the rocket is also a horizontal intercept. The \(t\)-value of \(0\) indicates the time when the rocket was launched from the ground. There is another horizontal intercept at the point \((4,0)\text{,}\) which means the rocket hit the ground after \(4\) seconds.
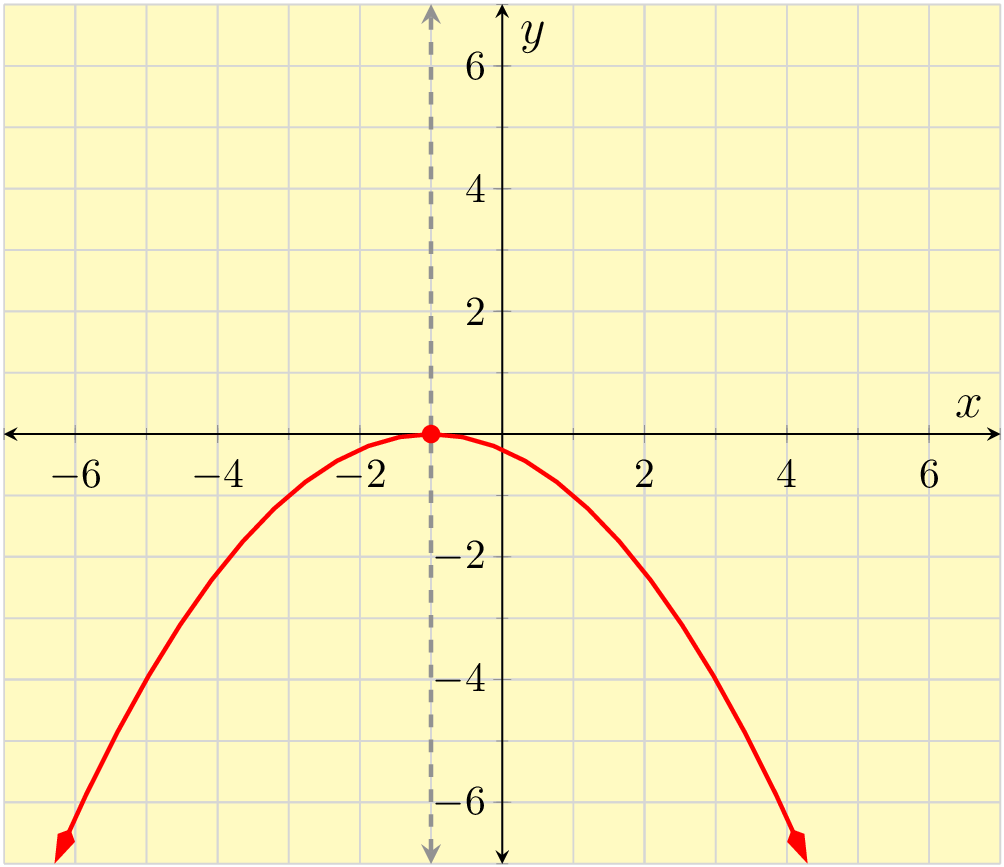
It is possible for a quadratic function to have \(0\text{,}\) \(1\) or \(2\) horizontal intercepts. The figures below show an example of each.
Here is a summary of the properties of quadratic functions:
A parabola opens upward if \(a\) is positive and opens downward of \(a\) is negative.
The vertex of a parabola is the maximum or minimum point on the graph.
The axis of symmetry is the vertical line that passes through the vertex.
The vertical intercept is the point where the function intersects the vertical axis. There is exactly one vertical intercept.
The horizontal intercept(s) are the points where a function intersects the horizontal axis. The graph of a parabola can have \(0, 1,\) or \(2\) horizontal intercepts.
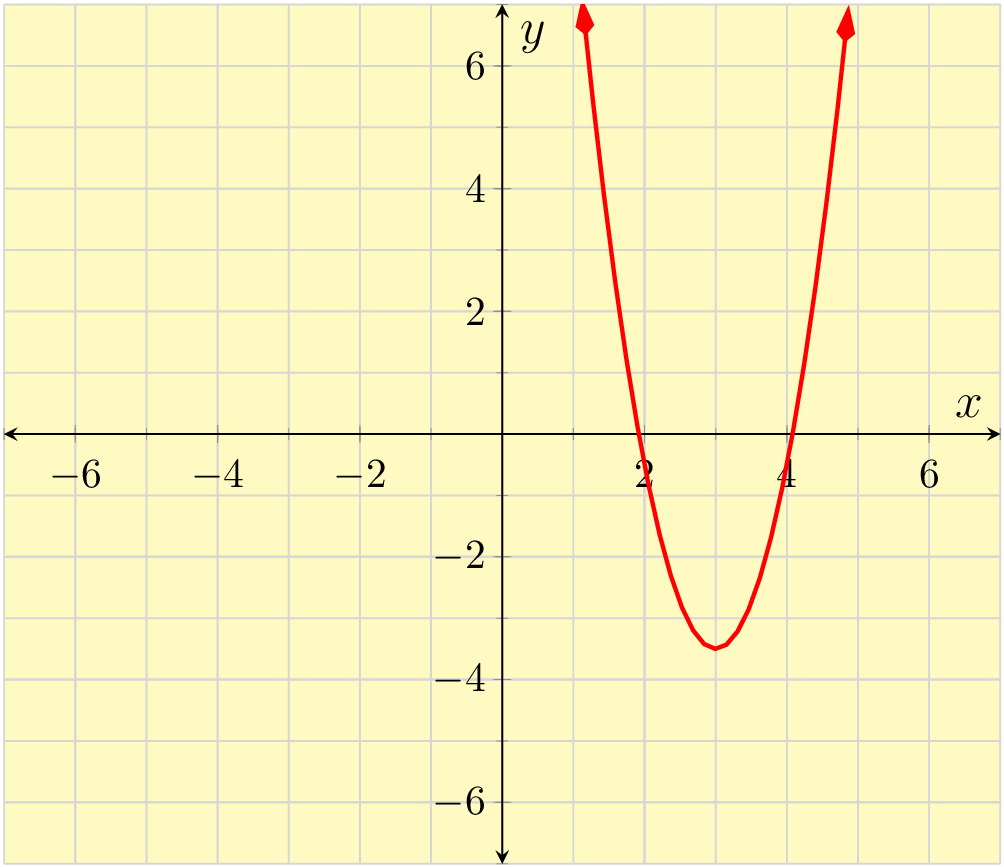
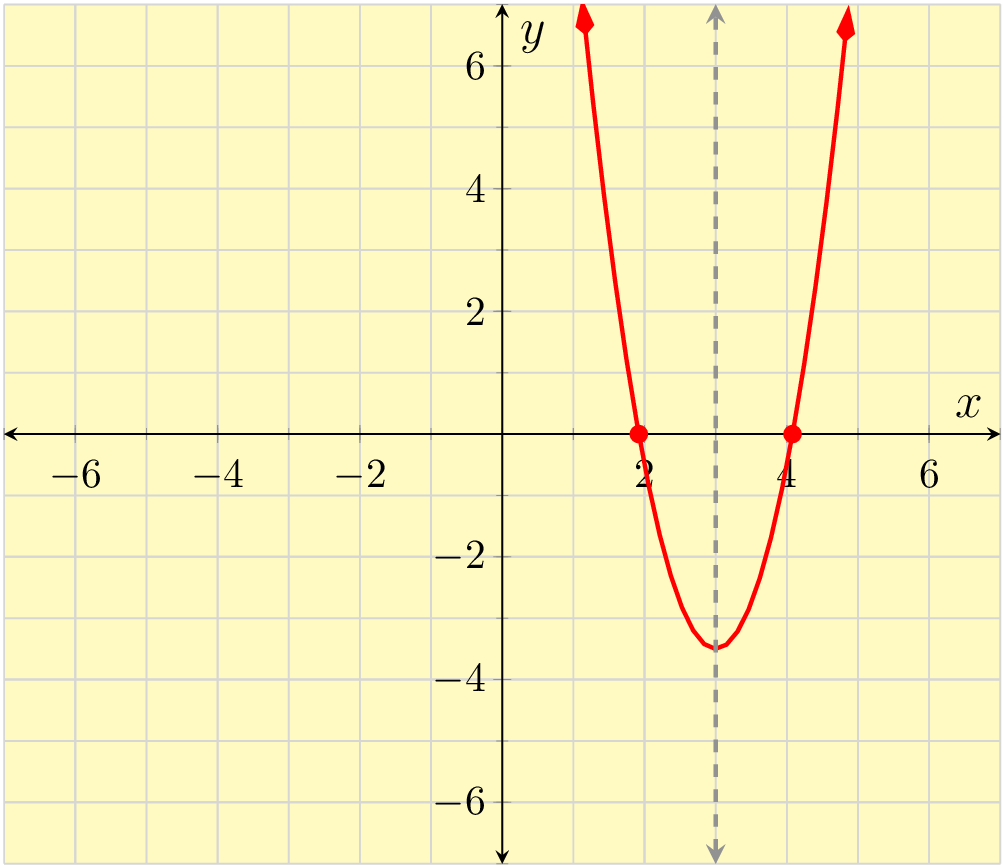
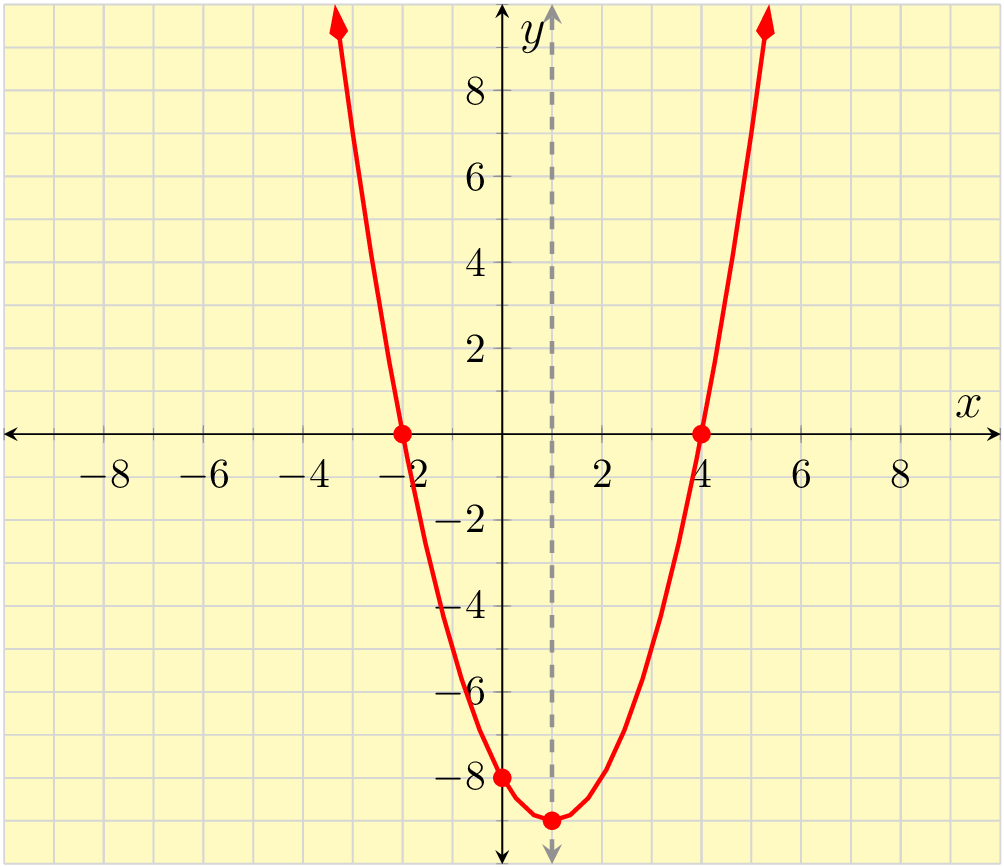
Identify the key features of the quadratic function \(y=x^2-2x-8\) shown in Figure 9.2.15.
First, we see that this parabola opens upward because the leading coefficient is positive.
Then we locate the vertex which is the point \((1,-9)\text{.}\) The axis of symmetry is the vertical line \(x=1\text{.}\)
The vertical intercept or \(y\)-intercept is the point \((0,-8)\text{.}\)
The horizontal intercepts are the points \((-2,0)\) and \((4,0)\text{.}\)
The coordinates of the vertex are not easy to identify on a graph if they are not integers. Another way to find it is by using a formula.
If we denote \((h,k)\) as the coordinates of the vertex of a quadratic function \(f(x)=ax^2+bx+c\text{,}\) then \(h=-\frac{b}{2a}\text{.}\)
To understand why, we can look at the quadratic formula. The vertex is on the axis of symmetry, so it will always occur halfway between the two \(x\)-intercepts (if there are any). The quadratic formula shows that the \(x\)-intercepts happen at \(-\frac{b}{2a}\) minus some number and at \(-\frac{b}{2a}\) plus that same number:
Determine the vertex and axis of symmetry of the quadratic function \(f(x)=x^2-4x-12\text{.}\)
We will find the \(x\)-value of the vertex using the formula \(h=-\frac{b}{2a}\text{,}\) for \(a=1\) and \(b=-4\text{.}\)
Now we know the \(x\)-value of the vertex is \(2\text{,}\) so we may evaluate \(f(2)\) to determine the \(y\)-value of the vertex:
The vertex is the point \((2,-16)\) and the axis of symmetry is the line \(x=2\text{.}\)
Determine the vertex and axis of symmetry of the quadratic function \(y=-3x^2-3x+7\text{.}\)
Using the formula \(h=-\frac{b}{2a}\) with \(a=-3\) and \(b=-3\text{,}\) we have :
Now that we've determined \(h=-\frac{1}{2}\text{,}\) we can substitute it for \(x\) to find the \(y\)-value of the vertex:
The vertex is the point \(\left(-\frac{1}{2},\frac{31}{4}\right)\) and the axis of symmetry is the line \(x=-\frac{1}{2}\text{.}\)
When we learned how to graph lines, we could choose any \(x\)-values. For quadratic functions, though, we want to find the vertex and choose our \(x\)-values around it. Then we can use the property of symmetry to help us. Let's look at an example.
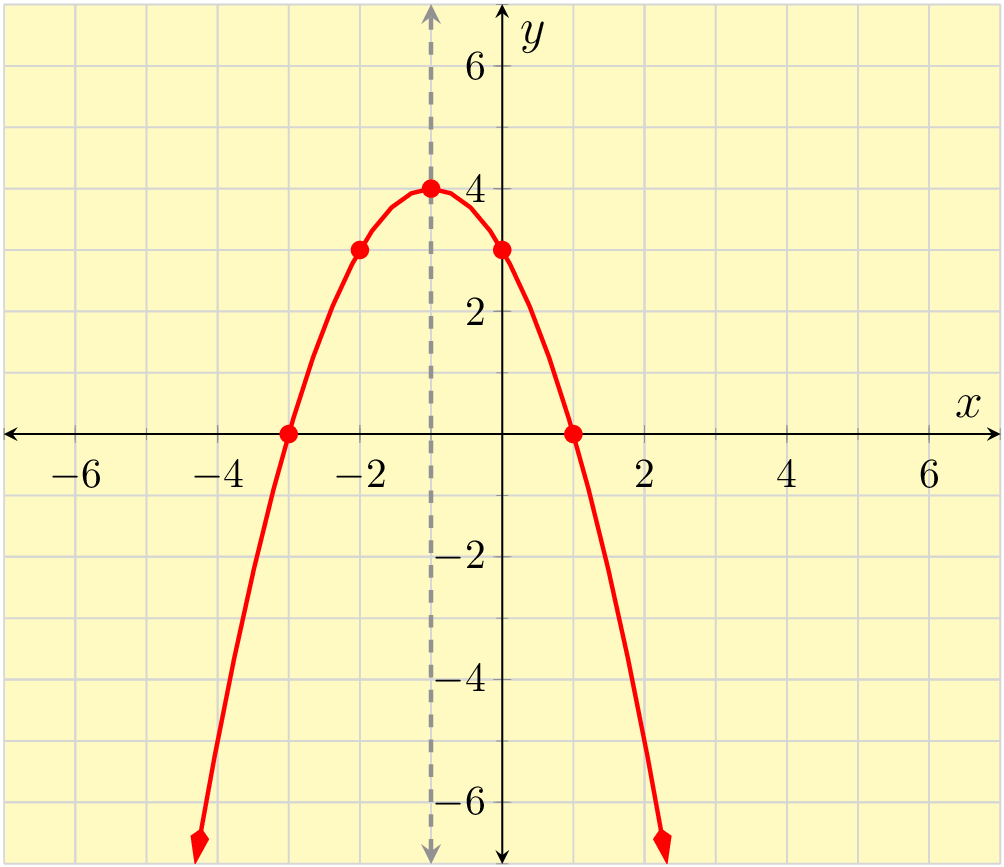
Determine the vertex and axis of symmetry for the quadratic function \(y=-x^2-2x+3\text{.}\) Then make a table of values and sketch the graph of the function.
To determine the vertex of \(y=-x^2-2x+3\text{,}\) we want to find the \(x\)-value of the vertex first. We use \(h=-\frac{b}{2a}\) with \(a=-1\) and \(b=-2\text{:}\)
To find the \(y\)-coordinate of the vertex, we substitute \(x=-1\) into the equation for our parabola.
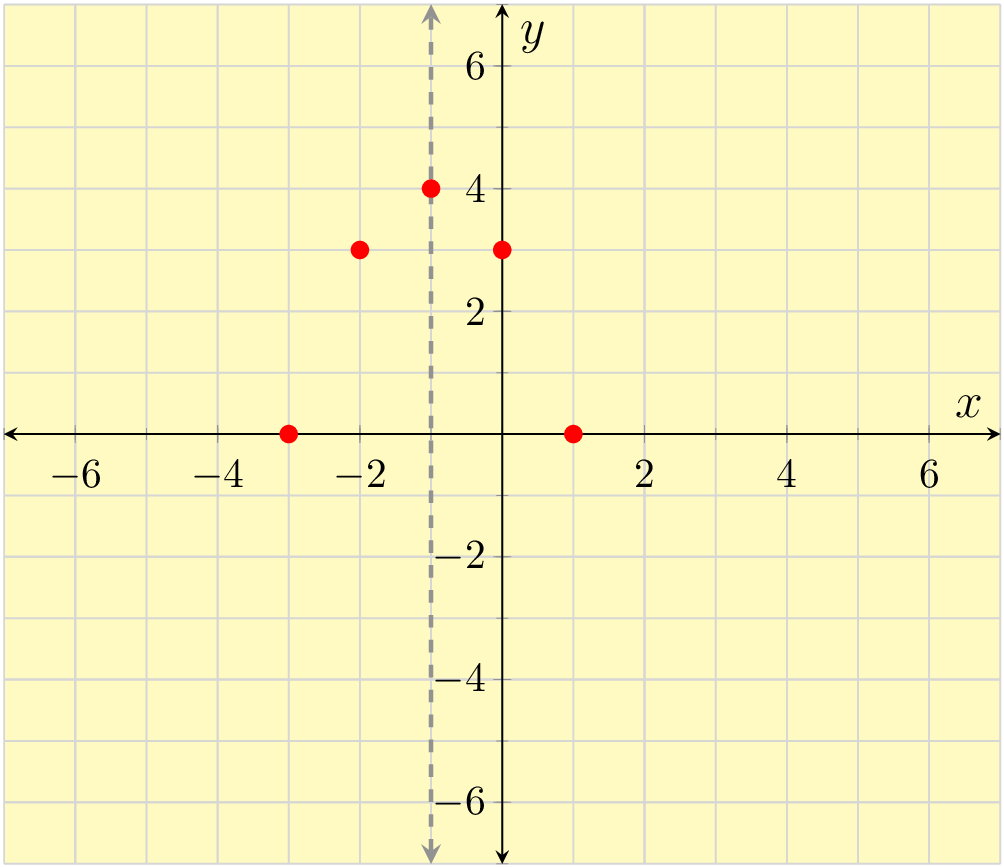
Now we know that our axis of symmetry is the line \(x=-1\) and the vertex is the point \((-1,4)\text{.}\) We will set up our table with two values on each side of \(x=-1\text{.}\) We choose \(x=-3, -2, -1, 0,\) and \(1\) as shown in Table 9.2.21.
Next, we'll determine the \(y\)-coordinates by replacing \(x\) with each value and we have the complete table as shown in Table 9.2.22. Notice that each pair of \(y\)-values on either side of the vertex match. This helps us to check that our vertex and \(y\)-values are correct.
| \(x\) | \(y=-x^2-2x+3\) | Point |
| \(-3\) | ||
| \(-2\) | ||
| \(-1\) | ||
| \(0\) | ||
| \(1\) |
| \(x\) | \(y=-x^2-2x+3\) | Point |
| \(-3\) | \(y=-(\substitute{-3})^2-2(\substitute{-3})+3=0\) | \((-3,0)\) |
| \(-2\) | \(y=-(\substitute{-2})^2-2(\substitute{-2})+3=3\) | \((-2,3)\) |
| \(-1\) | \(y=-(\substitute{-1})^2-2(\substitute{-1})+3=4\) | \((-1,4)\) |
| \(0\) | \(y=-(\substitute{0})^2-2(\substitute{0})+3=3\) | \((0,3)\) |
| \(1\) | \(y=-(\substitute{1})^2-2(\substitute{1})+3=0\) | \((1,0)\) |
Now that we have our table, we will plot the points and draw in the axis of symmetry as shown in Figure 9.2.23. We complete the graph by drawing a smooth curve through the points and drawing an arrow on each end as shown in Figure 9.2.24
The method we used works best when the \(x\)-value of the vertex is an integer. We can still make a graph if that is not the case as we will demonstrate in the next example.
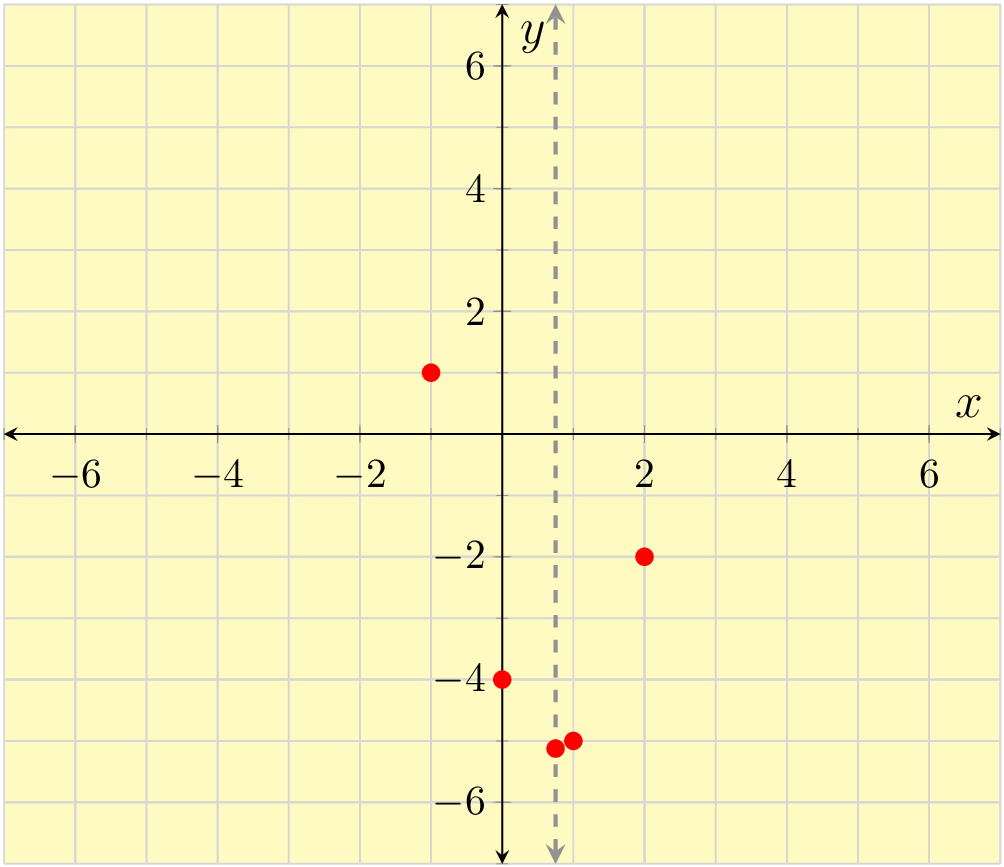
Determine the vertex and axis of symmetry for the quadratic function \(y=2x^2-3x-4\text{.}\) Use this to create a table of values and sketch the graph of this function.
To determine the vertex of \(y=2x^2-3x-4\text{,}\) we'll find \(h=-\frac{b}{2a}\) with \(a=2\) and \(b=-3\text{:}\)
Next, we'll determine the \(y\)-coordinate by replacing \(x\) with \(\frac{3}{4}\) in \(y=2x^2-3x-4\text{:}\)
Thus the vertex occurs at \(\left(\frac{3}{4},-\frac{41}{8}\right)\text{,}\) or at \((0.75,-5.125)\text{.}\) The axis of symmetry is then the line \(x=\frac{3}{4}\text{,}\) or \(x=0.75\text{.}\)
Now that we know the \(x\)-value of the vertex, we will create a table. We will choose \(x\)-values on both sides of \(x=0.75\text{,}\) but we will choose integers because it will be easier to find the function values.
| \(x\) | \(y=2x^2-3x-4\) | Point |
| \(-1\) | \(1\) | \((-1,1)\) |
| \(0\) | \(-4\) | \((0,-4)\) |
| \(0.75\) | \(-5.125\) | \((0.75,-5.125)\) |
| \(1\) | \(-5\) | \((1,-5)\) |
| \(2\) | \(-2\) | \((2,-2)\) |
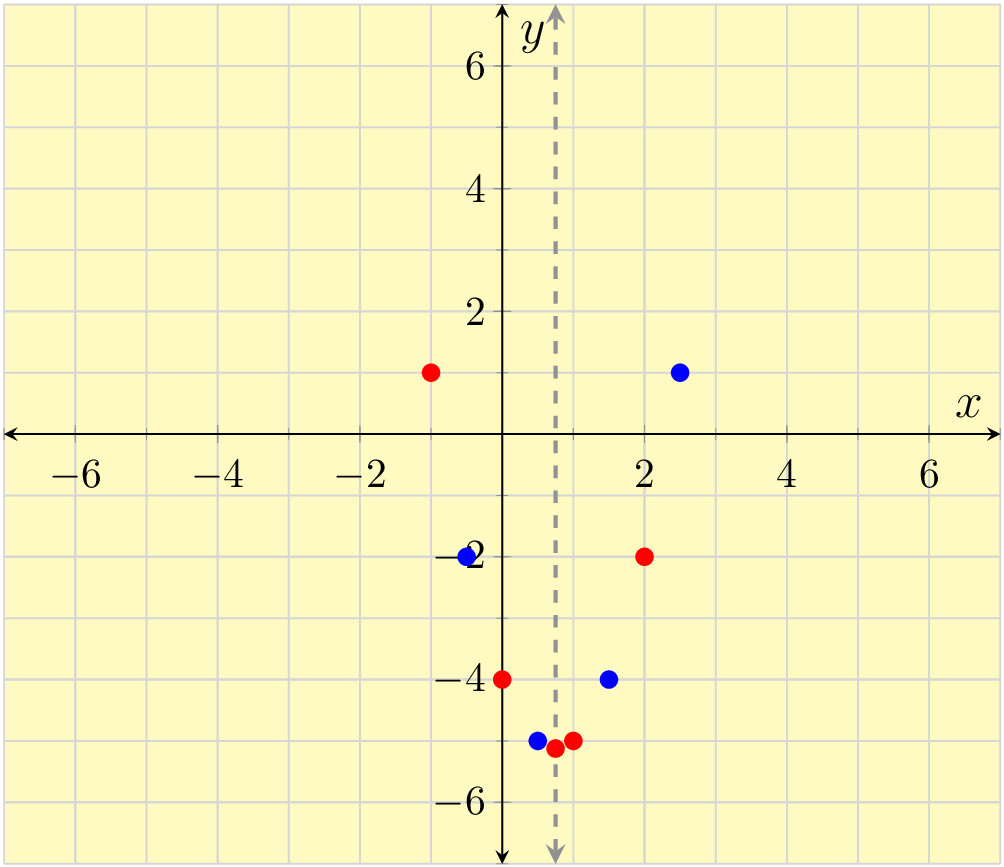
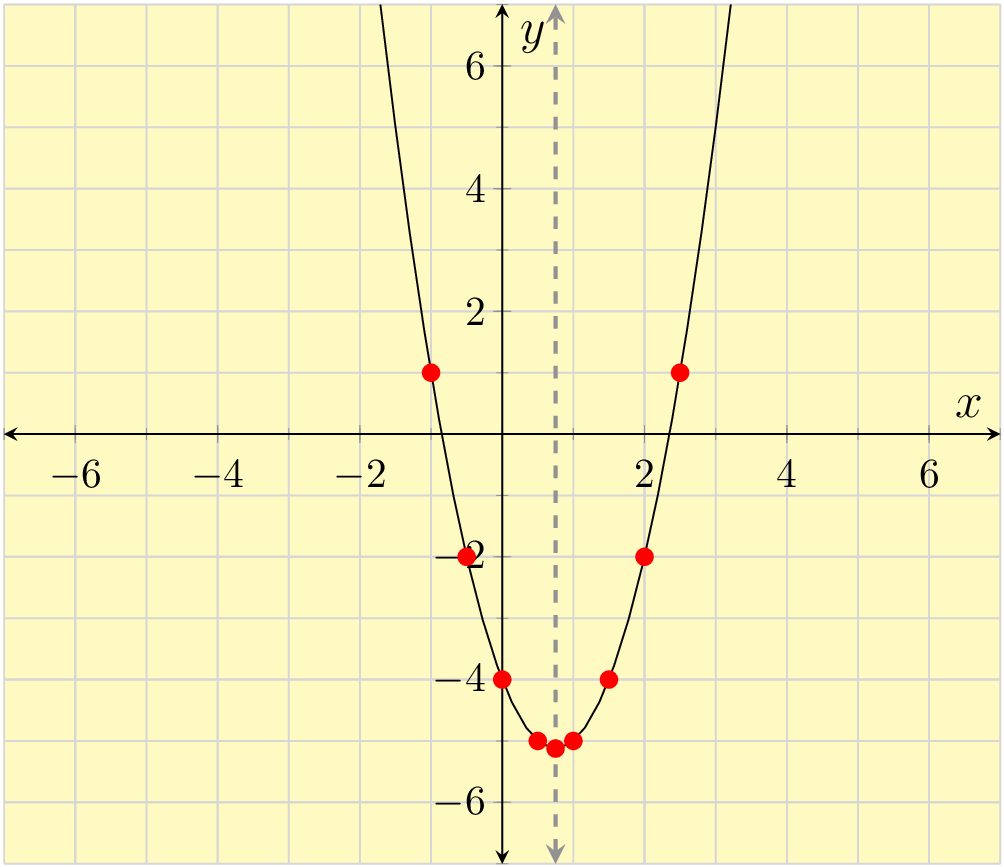
The points graphed in Figure 9.2.27 don't have the symmetry we'd expect from a parabola. This is because the vertex occurs at an \(x\)-value that is not an integer, and all of the chosen values in the table are integers. We can use the axis of symmetry to determine more points on the graph (as shown in Figure 9.2.28), which will give it the symmetry we expect. From there, we can complete the sketch of this graph.
In Example 9.1.32, we found the domain and range of different types of functions using their graphs. Now that we have graphed some quadratic functions, let's practice identifying the domain and range.
We graphed the quadratic function \(y=-x^2-2x+3\) in Figure 9.2.24. The domain is the set of all possible inputs to the function. The function is a continuous curve and when we look horizontally, one arrow points to the left and the other arrow points to the right. This means all \(x\)-values can be used in the function. The domain is \(\{x\mid x\ \textrm{is a real number}\}\) which is equivalent to \((-\infty,\infty)\text{.}\)
The range is the set of all outputs we can get from the function. For the range of this function we look vertically up and down the graph. This parabola opens downward, so both arrows point downward and the highest point along the graph is the vertex at \((-1,4)\text{.}\) The range is \(\{y \mid y \le 4\}\) which is equivalent to \((-\infty,4]\text{.}\)
Use the graph of \(y=2x^2-3x-4\) in Figure 9.2.29 and its vertex at \((0.75,-5.125)\) to identify the domain and range in set-builder and interval notation.
For the domain, we look horizontally and see the graph is a continuous curve and one arrow points to the left and the other arrow points to the right. The domain is \(\{x\mid x\ \textrm{is a real number}\}\) which is equivalent to \((-\infty,\infty)\text{.}\)
For the range we look vertically up and down the graph, which opens upward. Both arrows point upward and the lowest point on the graph is the vertex at \((0.75,-5.125)\text{.}\) The range is \(\{y \mid y \ge -5.125\}\) which is equivalent to \([-5.125,\infty)\text{.}\)
Since all parabolas have the same shape, they all have the same domain of \(\{x\mid x\ \textrm{is a real number}\}\) which is equivalent to \((-\infty,\infty)\text{.}\) The range depends on which way the parabola opens and the \(y\)-coordinate of the vertex. When we look at application problems, however, the domain and range will depend on the values that make sense in the given context. For example, times and lengths do not usually have negative values. We will revisit this after looking at some applications.
We looked at the height of Hannah's toy rocket with respect to time at the beginning of this section and saw that it reached a maximum height of \(64\) feet after \(2\) seconds. Let's look at some more applications that involve finding the minimum or maximum value of a quadratic function.
Imagine that Jae got a new air rifle to shoot targets. The first thing they did with it was to sight the scope at a certain distance so the pellets consistently hit where the cross hairs are pointed. In Olympic \(10\)-meter air rifle shooting 1 en.wikipedia.org/wiki/ISSF_10_meter_air_rifle, the bulls-eye is a 0.5 mm diameter dot, about the size of the head of a pin, so accuracy is key.
Jae would like to set up the air rifle scope to be accurate at a level distance of \(35\) yards (from the muzzle, which is the tip of the barrel), but they also need to know how much to correct for gravity at different distances. Since the projectile will be affected by gravity, knowing the distance that the target will be set up is essential to be accurate. After zeroing the scope reticule (cross-hairs) at \(35\) yards so that they can consistently hit the bulls-eye with the reticule directly over it, they set up targets at various distances to test the gun. Jae then shoots at the targets with the cross-hairs directly on the bulls-eye and measures the distance that the pellet hit above or below the bulls-eye when shot at those distances.
| Distance to Target in Yards | \(5\) | \(10\) | \(20\) | \(30\) | \(35\) | \(40\) | \(50\) |
| Above/Below Bulls-eye | \(\downarrow\) | \(\uparrow\) | \(\uparrow\) | \(\uparrow\) | \(\odot\) | \(\downarrow\) | \(\downarrow\) |
| Distance Above/Below in Inches | \(0.1\) | \(0.6\) | \(1.1\) | \(0.6\) | \(0\) | \(0.8\) | \(3.2\) |
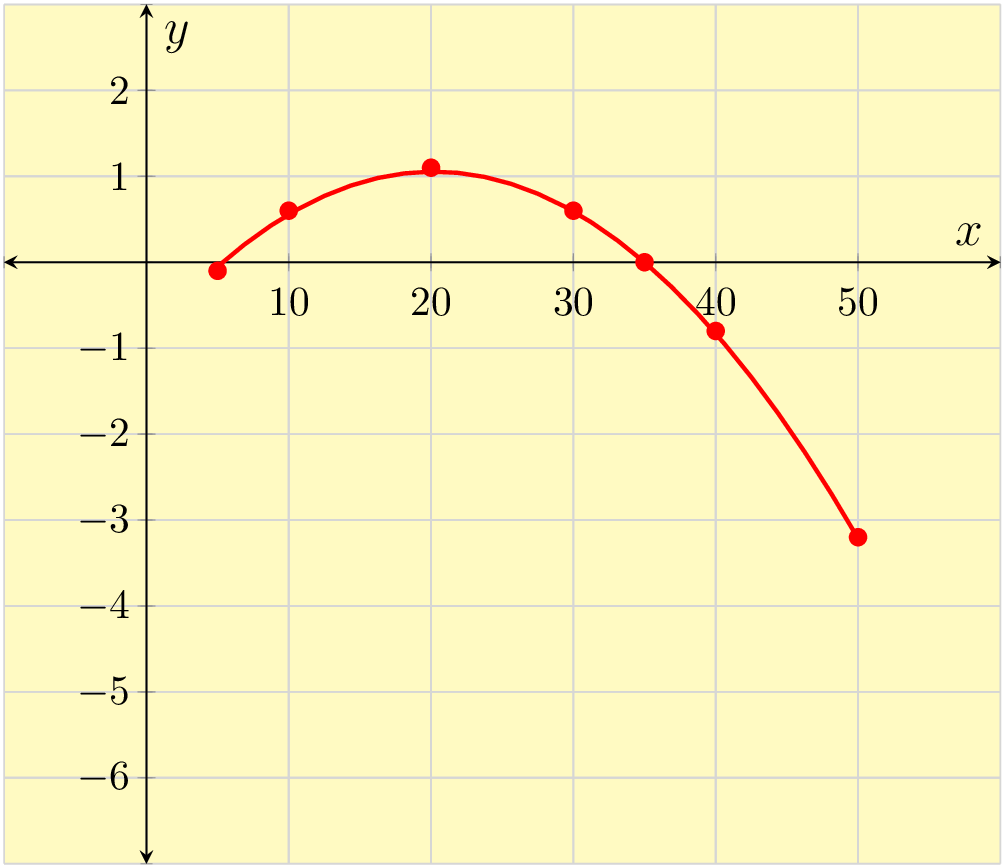
Make a graph of the height above the bulls-eye that Jae shoots at the distances listed in the table and find the vertex. What does the vertex mean in this context?
(Note that values measured below the bulls-eye should be graphed as negative \(y\)-values. Keep in mind that the units on the axes are different: along the \(x\)-axis, the units are yards, whereas on the \(y\)-axis, the units are inches.)
Since the input values seem to be going up by \(5\)s or \(10\)s, we will scale the \(x\)-axis by \(10\)s. The \(y\)-axis needs to be scaled by \(1\)s.
From the graph we can see that the point \((20,1.1)\) is our best guess for the real life vertex. This means the highest above the cross-hairs Jae hit was \(1.1\) inches when the target was \(20\) yards away.
We looked at the quadratic function \(R=(13+0.25x)(1500-50x)\) in Example 6.4.2 of Section 6.4, where \(R\) was the revenue (in dollars) for \(x\) 25-cent price increases. This function had each jar of Avery's jam priced at 13 dollars, and simplified to
Find the vertex of this quadratic function and explain what it means in the context of this model.
Note that if we tried to use \(R=(13+0.25x)(1500-50x)\text{,}\) we would not be able to immediately identify the values of \(a\) and \(b\) needed to determine the vertex. Using the expanded form of \(R=-12.5x^2-275x+19500\text{,}\) we see that \(a=-12.5\) and \(b=-275\text{,}\) so the vertex occurs at:
We will now find the value of \(R\) for \(x=-11\text{:}\)
Thus the vertex occurs at \((-11,21012.5)\text{.}\)
Literally interpreting this, we can state that \(-11\) of the \(25\)-cent price increases result in a maximum revenue of \(\$21{,}012.50\text{.}\)
We can calculate “\(-11\) of the 25-cent price increases” to be a decrease of \(\$2.75\text{.}\) The price was set at \(\$13\) per jar, so the maximum revenue of \(\$21{,}012.50\) would occur when Avery sets the price at \(\$10.25\) per jar.
Kali has \(500\) feet of fencing and she needs to build a rectangular pen for her goats. What are the dimensions of the rectangle that would give her goats the largest area?
We will use \(\ell\) for the length of the pen and \(w\) for the width, in feet. We know that the perimeter must be \(500\) feet so that gives us
First we will solve for the length:
Now we can build a function for the rectangle's area, using the formula for area:
The area is a quadratic function so we can identify \(a=-1\) and \(b=250\) and find the vertex:
Since the width of the rectangle is 125 feet, we can find the length using our expression:
To find the maximum area we can either substitute the width into the area function or multiply the length by the width:
The maximum area that Kali can get is \(15{,}625\) square feet if she builds her pen to be a square with a length and width of \(125\) feet.
Returning to the domain and range, we will look at the path of Hannah's toy rocket in Graph 9.2.4. Looking horizontally, the \(t\)-values make sense from \(0\) seconds, when the rocket is fired, until \(4\) seconds, when it comes back to the ground. This give us a domain of \(\{t\mid 0 \le t \le 4\}\) or \([0,4]\text{.}\) For the range, the height of the rocket goes from \(0\) feet on the ground and reaches a maximum height of \(64\) feet. The range is \(\{f(t)\mid 0 \le f(t) \le 64\}\) or \([0,64]\text{.}\)
In the air-rifle application in Example 9.2.32, the \(x\)-values are connected from \(5\) to \(50\) yards. If we assume that Jae will never be competing in target shoots beyond \(50\) yards, the domain will be \([5,50]\text{.}\) The \(y\)-values go from \(-3.2\) to \(1.1\) inches so the range is \([-3.2,1.1]\text{.}\)
In order to find the domain and range for many applications we need to know how to find the vertical and horizontal intercepts. We will look at that in the next section.
Make a table for the equation.
The first row is an example.
| \(x\) | \(y=-x+3\) | Points |
| \(-3\) | \(6\) | \(\left(-3,6\right)\) |
| \(-2\) | ||
| \(-1\) | ||
| \(0\) | ||
| \(1\) | ||
| \(2\) |
Make a table for the equation.
The first row is an example.
| \(x\) | \(y=-x+4\) | Points |
| \(-3\) | \(7\) | \(\left(-3,7\right)\) |
| \(-2\) | ||
| \(-1\) | ||
| \(0\) | ||
| \(1\) | ||
| \(2\) |
Make a table for the equation.
The first row is an example.
| \(x\) | \(y=\frac{5}{8} x - 1\) | Points |
| \(-24\) | \(-16\) | \(\left(-24,-16\right)\) |
| \(-16\) | ||
| \(-8\) | ||
| \(0\) | ||
| \(8\) | ||
| \(16\) |
Make a table for the equation.
The first row is an example.
| \(x\) | \(y=\frac{5}{4} x +7\) | Points |
| \(-12\) | \(-8\) | \(\left(-12,-8\right)\) |
| \(-8\) | ||
| \(-4\) | ||
| \(0\) | ||
| \(4\) | ||
| \(8\) |
Evaluate the expression \(\displaystyle \frac{1}{5} \big( x + 3 \big)^2 - 2\) when \(x = -8\text{.}\)
Evaluate the expression \(\displaystyle \frac{1}{2} \big( x + 4 \big)^2 - 7\) when \(x = -6\text{.}\)
Evaluate the expression \(-16t^{2}+64t+128\) when \(t=3\text{.}\)
Evaluate the expression \(-16t^{2}+64t+128\) when \(t=-5\text{.}\)
Find the axis of symmetry and vertex of the quadratic function.
\({y}={-4x^{2}-16x+5}\)
Axis of symmetry:
Vertex:
Find the axis of symmetry and vertex of the quadratic function.
\({y}={-3x^{2}+12x-2}\)
Axis of symmetry:
Vertex:
Find the axis of symmetry and vertex of the quadratic function.
\({y}={3-40x-4x^{2}}\)
Axis of symmetry:
Vertex:
Find the axis of symmetry and vertex of the quadratic function.
\({y}={-3-6x-3x^{2}}\)
Axis of symmetry:
Vertex:
Find the axis of symmetry and vertex of the quadratic function.
\({y}={-3-x^{2}-2x}\)
Axis of symmetry:
Vertex:
Find the axis of symmetry and vertex of the quadratic function.
\({y}={4-x^{2}-4x}\)
Axis of symmetry:
Vertex:
Find the axis of symmetry and vertex of the quadratic function.
\({y}={3x^{2}+6x}\)
Axis of symmetry:
Vertex:
Find the axis of symmetry and vertex of the quadratic function.
\({y}={4x^{2}-24x}\)
Axis of symmetry:
Vertex:
Find the axis of symmetry and vertex of the quadratic function.
\({y}={4-5x^{2}}\)
Axis of symmetry:
Vertex:
Find the axis of symmetry and vertex of the quadratic function.
\({y}={2-4x^{2}}\)
Axis of symmetry:
Vertex:
Find the axis of symmetry and vertex of the quadratic function.
\({y}={-3x^{2}+9x-4}\)
Axis of symmetry:
Vertex:
Find the axis of symmetry and vertex of the quadratic function.
\({y}={-2x^{2}-6x+2}\)
Axis of symmetry:
Vertex:
Find the axis of symmetry and vertex of the quadratic function.
\({y}={-2x^{2}+2x+5}\)
Axis of symmetry:
Vertex:
Find the axis of symmetry and vertex of the quadratic function.
\({y}={2x^{2}-10x-2}\)
Axis of symmetry:
Vertex:
Find the axis of symmetry and vertex of the quadratic function.
\({y}={3x^{2}}\)
Axis of symmetry:
Vertex:
Find the axis of symmetry and vertex of the quadratic function.
\({y}={0.4x^{2}}\)
Axis of symmetry:
Vertex:
Find the axis of symmetry and vertex of the quadratic function.
\({y}={0.5x^{2}+1}\)
Axis of symmetry:
Vertex:
Find the axis of symmetry and vertex of the quadratic function.
\({y}={5x^{2}-5}\)
Axis of symmetry:
Vertex:
Find the axis of symmetry and vertex of the quadratic function.
\({y}={-0.5\!\left(x-1\right)^{2}+3}\)
Axis of symmetry:
Vertex:
Find the axis of symmetry and vertex of the quadratic function.
\({y}={-0.4\!\left(x+4\right)^{2}-2}\)
Axis of symmetry:
Vertex:
For the given quadratic function, find the vertex. Then create a table of ordered pairs centered around the vertex and make a graph of the function.
\(f(x)=x^2+2\)
For the given quadratic function, find the vertex. Then create a table of ordered pairs centered around the vertex and make a graph of the function.
\(f(x)=x^2+1\)
For the given quadratic function, find the vertex. Then create a table of ordered pairs centered around the vertex and make a graph of the function.
\(f(x)=x^2-5\)
For the given quadratic function, find the vertex. Then create a table of ordered pairs centered around the vertex and make a graph of the function.
\(f(x)=x^2-3\)
For the given quadratic function, find the vertex. Then create a table of ordered pairs centered around the vertex and make a graph of the function.
\(f(x)=(x-2)^2\)
For the given quadratic function, find the vertex. Then create a table of ordered pairs centered around the vertex and make a graph of the function.
\(f(x)=(x-4)^2\)
For the given quadratic function, find the vertex. Then create a table of ordered pairs centered around the vertex and make a graph of the function.
\(f(x)=(x+3)^2\)
For the given quadratic function, find the vertex. Then create a table of ordered pairs centered around the vertex and make a graph of the function.
\(f(x)=(x+2)^2\)
For \(f(x)=4x^2-8x+5\text{,}\) determine the vertex, create a table of ordered pairs, and then graph the function.
For \(f(x)=2x^2+4x+7\text{,}\) determine the vertex, create a table of ordered pairs, and then graph the function.
For \(f(x)=-x^2+4x+2\text{,}\) determine the vertex, create a table of ordered pairs, and then graph the function.
For \(f(x)=-x^2+2x-5\text{,}\) determine the vertex, create a table of ordered pairs, and then graph the function.
For \(f(x)=x^2-5x+3\text{,}\) determine the vertex, create a table of ordered pairs, and then graph the function.
For \(f(x)=x^2+7x-1\text{,}\) determine the vertex, create a table of ordered pairs, and then graph the function.
For \(f(x)=-2x^2-5x+6\text{,}\) determine the vertex, create a table of ordered pairs, and then graph the function.
For \(f(x)=2x^2-9x\text{,}\) determine the vertex, create a table of ordered pairs, and then graph the function.
A function is graphed.
This function has domain and range .
A function is graphed.
This function has domain and range .
A function is graphed.
This function has domain and range .
A function is graphed.
This function has domain and range .
A function is graphed.
This function has domain and range .
A function is graphed.
This function has domain and range .
Consider two numbers where one number is \(10\) less than a second number. Find a pair of such numbers that has the least product possible. One approach is to let \(x\) represent the smaller number, and write a formula for a function of \(x\) that outputs the product of the two numbers. Then find its vertex and interpret it.
These two numbers are and the least possible product is .
Consider two numbers where one number is \(4\) less than a second number. Find a pair of such numbers that has the least product possible. One approach is to let \(x\) represent the smaller number, and write a formula for a function of \(x\) that outputs the product of the two numbers. Then find its vertex and interpret it.
These two numbers are and the least possible product is .
Consider two numbers where one number is \(10\) less than twice a second number. Find a pair of such numbers that has the least product possible. One approach is to let \(x\) represent the smaller number, and write a formula for a function of \(x\) that outputs the product of the two numbers. Then find its vertex and interpret it.
These two numbers are and the least possible product is .
Consider two numbers where one number is \(7\) less than twice a second number. Find a pair of such numbers that has the least product possible. One approach is to let \(x\) represent the smaller number, and write a formula for a function of \(x\) that outputs the product of the two numbers. Then find its vertex and interpret it.
These two numbers are and the least possible product is .
You will build a rectangular sheep enclosure next to a river. There is no need to build a fence along the river, so you only need to build on three sides. You have a total of \(440\) feet of fence to use. Find the dimensions of the pen such that you can enclose the maximum possible area. One approach is to let \(x\) represent the length of fencing that runs perpendicular to the river, and write a formula for a function of \(x\) that outputs the area of the enclosure. Then find its vertex and interpret it.
The length of the pen (parallel to the river) should be , the width (perpendicular to the river) should be , and the maximum possible area is .
You will build a rectangular sheep enclosure next to a river. There is no need to build a fence along the river, so you only need to build on three sides. You have a total of \(460\) feet of fence to use. Find the dimensions of the pen such that you can enclose the maximum possible area. One approach is to let \(x\) represent the length of fencing that runs perpendicular to the river, and write a formula for a function of \(x\) that outputs the area of the enclosure. Then find its vertex and interpret it.
The length of the pen (parallel to the river) should be , the width (perpendicular to the river) should be , and the maximum possible area is .
You will build a rectangular sheep enclosure next to a river. There is no need to build a fence along the river, so you only need to build on three sides. You have a total of \(470\) feet of fence to use. Find the dimensions of the pen such that you can enclose the maximum possible area. One approach is to let \(x\) represent the length of fencing that runs perpendicular to the river, and write a formula for a function of \(x\) that outputs the area of the enclosure. Then find its vertex and interpret it.
The length of the pen (parallel to the river) should be , the width (perpendicular to the river) should be , and the maximum possible area is .
You will build a rectangular sheep enclosure next to a river. There is no need to build a fence along the river, so you only need to build on three sides. You have a total of \(480\) feet of fence to use. Find the dimensions of the pen such that you can enclose the maximum possible area. One approach is to let \(x\) represent the length of fencing that runs perpendicular to the river, and write a formula for a function of \(x\) that outputs the area of the enclosure. Then find its vertex and interpret it.
The length of the pen (parallel to the river) should be , the width (perpendicular to the river) should be , and the maximum possible area is .
You will build two identical rectangular enclosures next to a each other, sharing a side. You have a total of \(408\) feet of fence to use. Find the dimensions of each pen such that you can enclose the maximum possible area. One approach is to let \(x\) represent the length of fencing that the two pens share, and write a formula for a function of \(x\) that outputs the total area of the enclosures. Then find its vertex and interpret it.
The length of each (along the wall that they share) should be , the width should be , and the maximum possible area of each pen is .
You will build two identical rectangular enclosures next to a each other, sharing a side. You have a total of \(420\) feet of fence to use. Find the dimensions of each pen such that you can enclose the maximum possible area. One approach is to let \(x\) represent the length of fencing that the two pens share, and write a formula for a function of \(x\) that outputs the total area of the enclosures. Then find its vertex and interpret it.
The length of each (along the wall that they share) should be , the width should be , and the maximum possible area of each pen is .
You plan to build four identical rectangular animal enclosures in a row. Each adjacent pair of pens share a fence between them. You have a total of \(312\) feet of fence to use. Find the dimensions of each pen such that you can enclose the maximum possible area. One approach is to let \(x\) represent the length of fencing that adjacent pens share, and write a formula for a function of \(x\) that outputs the total area. Then find its vertex and interpret it.
The length of each pen (along the walls that they share) should be , the width (perpendicular to the river) should be , and the maximum possible area of each pen is .
You plan to build four identical rectangular animal enclosures in a row. Each adjacent pair of pens share a fence between them. You have a total of \(328\) feet of fence to use. Find the dimensions of each pen such that you can enclose the maximum possible area. One approach is to let \(x\) represent the length of fencing that adjacent pens share, and write a formula for a function of \(x\) that outputs the total area. Then find its vertex and interpret it.
The length of each pen (along the walls that they share) should be , the width (perpendicular to the river) should be , and the maximum possible area of each pen is .
Currently, an artist can sell \(240\) paintings every year at the price of \({\$90.00}\) per painting. Each time he raises the price per painting by \({\$15.00}\text{,}\) he sells \(5\) fewer paintings every year.
To obtain maximum income of , the artist should set the price per painting at .
To earn \({\$43{,}875.00}\) per year, the artist could sell his paintings at two different prices. The lower price is per painting, and the higher price is per painting.
Currently, an artist can sell \(270\) paintings every year at the price of \({\$150.00}\) per painting. Each time he raises the price per painting by \({\$5.00}\text{,}\) he sells \(5\) fewer paintings every year.
To obtain maximum income of , the artist should set the price per painting at .
To earn \({\$43{,}700.00}\) per year, the artist could sell his paintings at two different prices. The lower price is per painting, and the higher price is per painting.


