
Example 9.4.1 Introduction to Functions
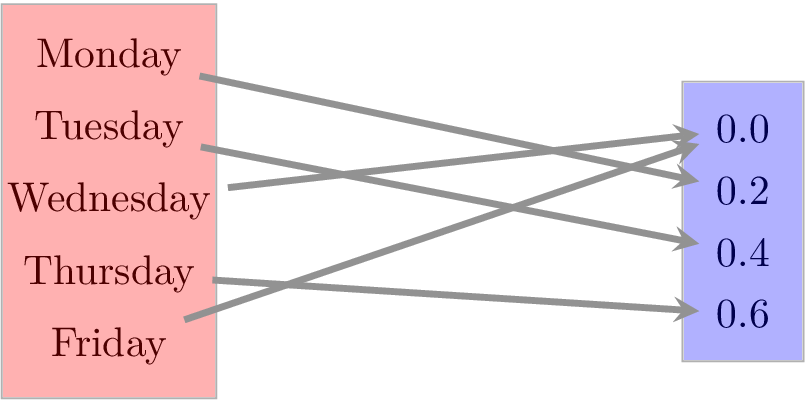
One week in Portland, it was rainy. Shocking, I know. Shown is a diagram for the day of the week and how much rain fell on those days. Convert this diagram to a set of ordered pairs where the first coordinate is the day of the week and the second coordinate is the amount of rain that fell in Portland that day, in inches.

Explanation
Since Monday has an arrow to \(0.2\text{,}\) that must mean that it rained \(0.2\) inches of rain on Monday. That gives us the ordered pair \((\text{Monday},0.2)\text{.}\) Likewise, we also have \((\text{Tuesday},0.4)\text{.}\) To write down all of the ordered pairs, we will use a set:
\begin{equation*}
\left\{(\text{Monday},0.2), (\text{Tuesday},0.4), (\text{Wednesday},0.0), (\text{Thursday},0.6), (\text{Friday},0.0)\right\}
\end{equation*}


