
Section 5.2 Confidence intervals
¶The site fivethirtyeight.com regularly forecasts support for each candidate in Congressional races, i.e. races in the US House of Representatives and the US Senate. In addition to point estimates, they report confidence intervals. 1 What are confidence intervals, and how do we interpret them?
Subsection 5.2.1 Learning objectives
Explain the purpose and use of confidence intervals.
Construct 95% confidence intervals assuming the point estimate follows a normal distribution.
Calculate the critical value for a C% confidence interval when the point estimate follows a normal distribution.
Describe how sample size and confidence level affect the width of a confidence interval.
Interpret a confidence interval and the confidence level in context.
Draw conclusions with a specified confidence level about the values of unknown parameters.
Calculate and interpret the margin of error for a C% confidence interval. Distinguish between margin of error and standard error.
Subsection 5.2.2 Capturing the population parameter
A point estimate provides a single plausible value for a parameter. However, a point estimate isn't perfect and will have some standard error associated with it. When estimating a parameter, it is better practice to provide a plausible range of values instead of supplying just the point estimate.
A plausible range of values for the population parameter is called a confidence interval. Using only a point estimate is like fishing in a murky lake with a spear, and using a confidence interval is like fishing with a net. We can throw a spear where we saw a fish, but we will probably miss. On the other hand, if we toss a net in that area, we have a good chance of catching the fish.
If we report a point estimate, we probably will not hit the exact population parameter. On the other hand, if we report a range of plausible values — a confidence interval — we have a good shot at capturing the parameter.
Subsection 5.2.3 Constructing a 95% confidence interval
A point estimate is our best guess for the value of the parameter, so it makes sense to build the confidence interval around that value. The standard error is a measure of the uncertainty associated with the point estimate.
Example 5.2.1.
How many standard errors should we extend above and below the point estimate if we want to be 95% confident of capturing the true value?
First, we observe that the area under the standard normal curve between -1.96 and 1.96 is 95%. When conditions for a normal model are met, the point estimate we observe will be within 1.96 standard deviations of the true value about 95% of the time. Thus, if we want to be 95% confident of capturing the true value, we should go 1.96 standard errors on either side of the point estimate.
Constructing a 95% confidence interval using a normal model.
When the sampling distribution of a point estimate can reasonably be modeled as normal, a 95% confidence interval for the unknown parameter can be constructed as:
We can be 95% confident that this interval captures the true value.
In the next chapters we will determine when we can apply a normal model to a point estimate. For now, we will assume that a normal model is reasonable.
Example 5.2.2.
The point estimate from the smoking example was 15%. The standard error for this point estimate was calculated to be \(SE = 0.04\text{.}\) Assuming that conditions for a normal model are met, construct and interpret a 95% confidence interval.
We are 95% confident that the true percent of smokers in this population is between 7.16% and 22.84%.
Example 5.2.3.
Based on the confidence interval above, is there evidence that a smaller proportion smoke in this county than in the state as a whole? The proportion that smoke in the state is known to be 0.20.
While the point estimate of 0.15 is lower than 0.20, this deviation is likely due to random chance. Because the confidence interval includes the value 0.20, 0.20 is a reasonable value for the proportion of smokers in the county. Therefore, based on this confidence interval, we do not have evidence that a smaller proportion smoke in the county than in the state.
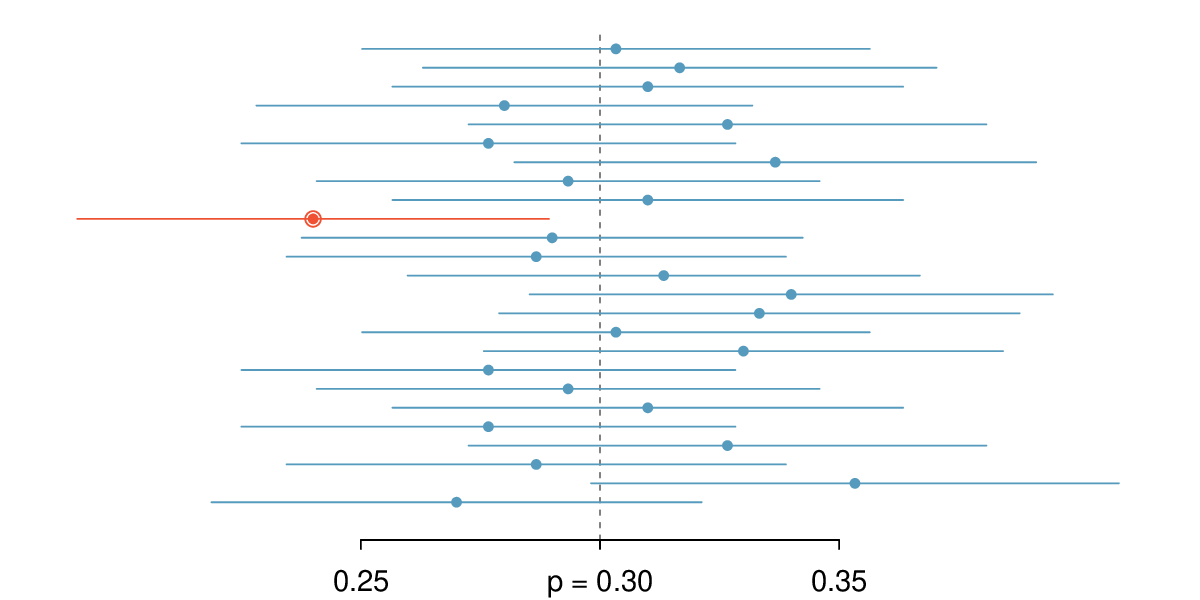
We can be 95% confident that a 95% confidence interval captures the true population parameter. However, confidence intervals are imperfect. About 1-in-20 (5%) properly constructed 95% confidence intervals will fail to capture the parameter of interest. Figure 5.2.4 shows 25 confidence intervals for a proportion that were constructed from simulations where the true proportion was \(p = 0.3\text{.}\) However, 1 of these 25 confidence intervals happened not to include the true value.
Checkpoint 5.2.5.
In Figure 5.2.4, one interval does not capture the true proportion, \(p = 0.3\text{.}\) Does this imply that there was a problem with the simulations? 2
Subsection 5.2.4 Changing the confidence level
¶Suppose we want to construct a confidence interval with a confidence level somewhat greater than 95%: perhaps we would like a confidence level of 99%.
Example 5.2.6.
Other things being equal, would a 99% confidence interval be wider or narrower than a 95% confidence interval?
Using a previous analogy: if we want to be more confident that we will catch a fish, we should use a wider net, not a smaller one. To be 99% confidence of capturing the true value, we must use a wider interval. On the other hand, if we want an interval with lower confidence, such as 90%, we would use a narrower interval.
The 95% confidence interval structure provides guidance in how to make intervals with new confidence levels. Below is a general 95% confidence interval for a point estimate that comes from a nearly normal distribution:
There are three components to this interval: the point estimate, “1.96”, and the standard error. The choice of \(1.96\times SE\) was based on capturing 95% of the distribution since the estimate is within 1.96 standard deviations of the true value about 95% of the time. The choice of 1.96 corresponds to a 95% confidence level.
Checkpoint 5.2.7.
If \(X\) is a normally distributed random variable, how often will \(X\) be within 2.58 standard deviations of the mean? 3
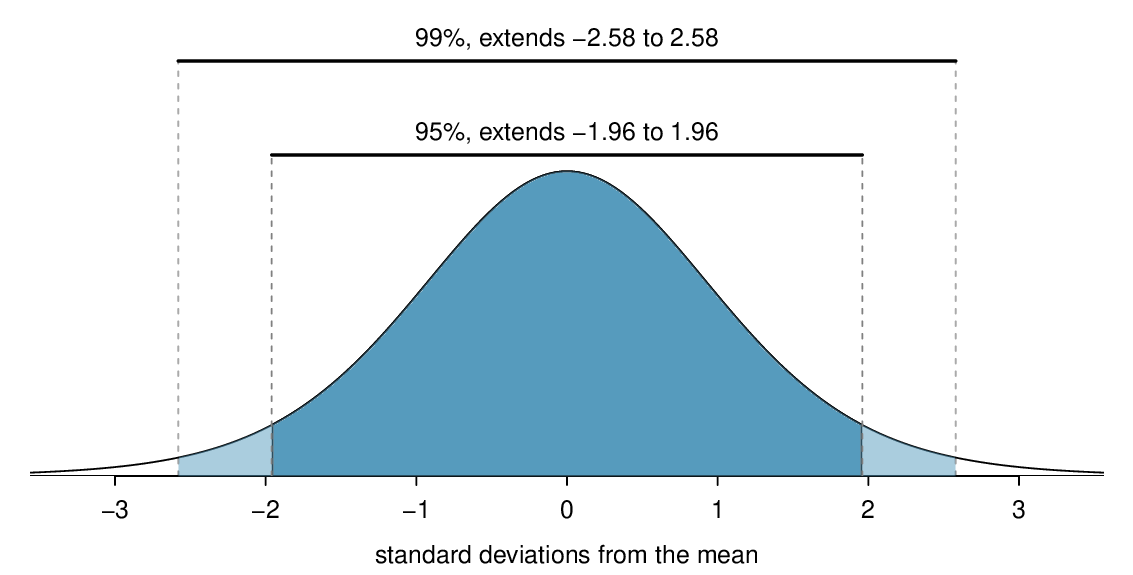
To create a 99% confidence interval, change 1.96 in the 95% confidence interval formula to be \(2.58\text{.}\) Checkpoint 5.2.7 highlights that 99% of the time a normal random variable will be within 2.58 standard deviations of its mean. Thus, the formula for a 99% confidence interval is
Figure 5.2.8 provides a picture of how to identify \(z^{\star}\) based on a confidence level.
The number of standard errors we go above and below the point estimate is called the critical value. When the critical value is determined based on a normal model, we call the critical value \(z^{\star}\text{.}\)
Confidence interval for any confidence level.
If the point estimate follows a normal model with standard error \(SE\text{,}\) then a confidence interval for the population parameter is
where \(z^{\star}\) depends on the confidence level selected.
Finding the value of \(z^{\star}\) that corresponds to a particular confidence level is most easily accomplished by using a new table, called the \(t\)-table. For now, what is noteworthy about this table is that the bottom row corresponds to confidence levels. The numbers inside the table are the critical values, but which row should we use? Later in this book, we will see that a \(t\)-curve with infinite degrees of freedom corresponds to the normal curve. For this reason, when finding \(z^{\star}\text{,}\) we use the \(t\)-table at row \(\infty\text{.}\)
| one tail | 0.100 | 0.050 | 0.025 | 0.010 | 0.005 | |
| \(df\) | 1 | 3.078 | 6.314 | 12.71 | 31.82 | 63.66 |
| 2 | 1.886 | 2.920 | 4.303 | 6.965 | 9.925 | |
| 3 | 1.638 | 2.353 | 3.182 | 4.541 | 5.841 | |
| \(\vdots\) | \(\vdots\) | \(\vdots\) | \(\vdots\) | \(\vdots\) | ||
| 1000 | 1.282 | 1.646 | 1.962 | 2.330 | 2.581 | |
| \(\infty\) | 1.282 | 1.645 | 1.960 | 2.326 | 2.576 | |
| Confidence level C | 80% | 90% | 95% | 98% | 99% | |
Finding \({z}^{\star}\) for a particular confidence level.
We select \(z^{\star}\) so that the area between -\(z^{\star}\) and \(z^{\star}\) in the normal model corresponds to the confidence level. Use a calculator or use the \(t\)-table at row \(\infty\) to find the critical value \(z^{\star}\text{.}\)
Checkpoint 5.2.10.
Find the appropriate \(z^{\star}\) value for an 80% confidence interval. 4
The normal approximation is crucial to the precision of these confidence intervals. The next two chapters provide detailed discussions about when a normal model can safely be applied to a variety of situations. When a normal model is not a good fit, we will use alternate distributions that better characterize the sampling distribution.
Subsection 5.2.5 Margin of error
¶The confidence intervals we have encountered thus far have taken the form
Confidence intervals are also often reported as
For example, instead of reporting an interval as \(0.09 \ \pm \ 1.645\times 0.028\) or \((0.044, 0.136)\text{,}\) it could be reported as \(0.09 \ \pm \ 0.046\text{.}\)
The margin of error is the distance between the point estimate and the lower or upper bound of a confidence interval. It is half of the total width of the interval.
Margin of error.
When the point estimate follows a normal distribution,
Example 5.2.11.
All other things being equal, will the margin of error be bigger for a 68% confidence interval or a 95% confidence interval?
A 95% confidence interval is wider than a 68% confidence interval and has a larger \(z^{\star}\) value, so the 95% confidence interval will have a larger margin of error.
Checkpoint 5.2.12.
What is the margin of error for the confidence interval: (0.035, 0.145)? 5
Subsection 5.2.6 Interpreting confidence intervals
¶A careful eye might have observed the somewhat awkward language used to describe confidence intervals. Correct interpretation:
We are C% confident that the population parameter is between and .
Incorrect language might try to describe the confidence interval as capturing the population parameter with a certain probability. 6 Applying the language of probability to a fixed interval or to a fixed parameter is one of the most common errors.
As we saw in Figure 5.2.4, the 95% confidence interval method has a 95% probability of producing an interval that will capture the population parameter. A correct interpretation of the confidence level is that such intervals will capture the population parameter that percent of the time (assuming conditions are met and the probability model is true). However, each individual interval either does or does not capture the population parameter. A correct interpretation of an individual confidence interval cannot involve the vocabulary of probability.
Another especially important consideration of confidence intervals is that they only try to capture the population parameter. Our intervals say nothing about the confidence of capturing individual observations, a proportion of the observations, or point estimates. Confidence intervals only attempt to capture population parameters.
Subsection 5.2.7 Confidence interval procedures: a five step process
Use a confidence interval to estimate a parameter with a particular confidence level, C.
(AP exam tip) When carrying out a confidence intervaL procedure, follow these five steps:.
Identify: Identify the parameter and the confidence level.
Choose: Choose the appropriate interval procedure and identify it by name.
Check: Check that the conditions for the interval procedure are met.
-
Calculate: Calculate the confidence interval and record it in interval form.
\begin{gather*} \text{ CI: point estimate } \ \pm\ \text{ critical value } \times SE \text{ of estimate } \end{gather*} Conclude: Interpret the interval and, if applicable, draw a conclusion based on whether the interval is entirely above, is entirely below, or contains the value of interest.
Subsection 5.2.8 Section summary
A point estimate is not perfect; there is almost always some error in the estimate. It is often useful to supply a plausible range of values for the parameter, which we call a confidence interval.
A confidence interval is centered on the point estimate and extends a certain number of standard errors on either side of the estimate, depending upon how confident one wants to be. For a fixed sample size, to be more confident of capturing the true value requires a wider interval.
-
When the sampling distribution of a point estimate can reasonably be modeled as normal, such as with a sample proportion, then the following are true:
A 68% confidence interval is given by: point estimate \(\pm\ SE\) of estimate. We can be 68% confident this interval captures the true value.
A 95% confidence interval is given by: point estimate \(\pm\ 1.96 \times SE\) of estimate. We can be 95% confident this interval captures the true value.
A C% confidence interval is given by: point estimate \(\pm\ z^{\star} \times SE\) of estimate. We can be C% confident this interval captures the true value.
For a C% confidence interval described above, we select \(z^{\star}\) such that the area between -\(z^{\star}\) and \(z^{\star}\) under the standard normal curve is C%. Use the \(t\)-table at row \(\infty\) to find the critical value \(z^{\star}\text{.}\) 7
-
After interpreting the interval, we can usually draw a conclusion, with C% confidence, about whether a given value X is a reasonable value for the population parameter. When drawing a conclusion based on a confidence interval, there are three possibilities.
-
We have evidence that the true [parameter]:
...is greater than X, because the entire interval is above X.
...is less than X, because the entire interval is below X.
We do not have evidence that the true [parameter] is not X, because X is in the interval.
-
-
AP exam tip: A full confidence interval procedure includes the following steps.
Identify: Identify the parameter and the confidence level.
Choose: Choose the appropriate interval procedure and identify it by name.
Check: Check that the conditions for the interval procedure are met.
-
Calculate: Calculate the confidence interval and record it in interval form.
\begin{gather*} \text{ CI: point estimate } \ \pm\ \text{ critical value } \times SE \text{ of estimate } \end{gather*} Conclude: Interpret the interval and, if applicable, draw a conclusion based on whether the interval is entirely above, is entirely below, or contains the value of interest.
Interpreting confidence intervals and confidence levels
68% and 95% are examples of confidence levels. The confidence level tells us the capture rate with repeated sampling. For example, a correct interpretation of a 95% confidence level is that if many samples of the same size were taken from the population, about 95% of the resulting confidence intervals would capture the true population parameter (assuming the conditions are met and the probability model is true). Note that this is a relative frequency interpretation.
We cannot use the language of probability to interpret an individual confidence interval, once it has been calculated. The confidence level tells us what percent of the intervals will capture the population parameter, not the probability that a calculated interval captures the population parameter. Each calculated interval either does or does not capture the population parameter.
Margin of error
Confidence intervals are often reported as: point estimate \(\pm\) margin of error. The margin of error (\(ME\)) \(=\text{ critical value } \times SE\ \text{ of estimate }\text{,}\) and it tells us, with a particular confidence, how much we expect our point estimate to deviate from the true population value due to chance.
The margin of error depends on the confidence level; the standard error does not. Other things being constant, a higher confidence level leads to a larger margin of error.
For a fixed confidence level, increasing the sample size decreases the margin of error. This assumes a random sample.
The margin of error formula only applies if a sample is random. Moreover, the margin of error measures only sampling error; it does not account for additional error introduced by response bias and non-response bias. Even with a perfectly random sample, the actual error in a poll is likely higher than the reported margin of error. 8
Exercises 5.2.9 Exercises
1. Chronic illness, Part I.
In 2013, the Pew Research Foundation reported that “45% of U.S. adults report that they live with one or more chronic conditions”. 9 However, this value was based on a sample, so it may not be a perfect estimate for the population parameter of interest on its own. The study reported a standard error of about 1.2%, and a normal model may reasonably be used in this setting. Create a 95% confidence interval for the proportion of U.S. adults who live with one or more chronic conditions. Also interpret the confidence interval in the context of the study.
Recall that the general formula is point estimate \(\text{point estiamte } \pm z^* \times SE\text{.}\) First, identify the three different values. The point estimate is 45%, \(z^* = 1.96\) for a 95% confidence level, and \(SE = 1.2%\text{.}\) Then, plug the values into the formula: \(45% \pm 1.96 \times 1.2% \rightarrow (42.6%, 47.4%)\) We are 95% confident that the proportion of US adults who live with one or more chronic conditions is between 42.6% and 47.4%.
2. Twitter users and news, Part I.
A poll conducted in 2013 found that 52% of U.S. adult Twitter users get at least some news on Twitter. 10 . The standard error for this estimate was 2.4%, and a normal distribution may be used to model the sample proportion. Construct a 99% confidence interval for the fraction of U.S. adult Twitter users who get some news on Twitter, and interpret the confidence interval in context.
3. Chronic illness, Part II.
In 2013, the Pew Research Foundation reported that “45% of U.S. adults report that they live with one or more chronic conditions”, and the standard error for this estimate is 1.2%. Identify each of the following statements as true or false. Provide an explanation to justify each of your answers.
We can say with certainty that the confidence interval from Exercise 5.2.9.1 contains the true percentage of U.S. adults who suffer from a chronic illness.
If we repeated this study 1,000 times and constructed a 95% confidence interval for each study, then approximately 950 of those confidence intervals would contain the true fraction of U.S. adults who suffer from chronic illnesses.
The poll provides statistically significant evidence (at the \(\alpha = 0.05\) level) that the percentage of U.S. adults who suffer from chronic illnesses is below 50%.
Since the standard error is 1.2%, only 1.2% of people in the study communicated uncertainty about their answer.
(a) False. Confidence intervals provide a range of plausible values, and sometimes the truth is missed. A 95% confidence interval “misses” about 5% of the time.
(b) True. Notice that the description focuses on the true population value.
(c) True. If we examine the 95% confidence interval computed in Exercise 5.2.9.3, we can see that 50% is not included in this interval. This means that in a hypothesis test, we would reject the null hypothesis that the proportion is 0.5.
(d) False. The standard error describes the uncertainty in the overall estimate from natural fluctuations due to randomness, not the uncertainty corresponding to individuals' responses.
4. Twitter users and news, Part II.
A poll conducted in 2013 found that 52% of U.S. adult Twitter users get at least some news on Twitter, and the standard error for this estimate was 2.4%. Identify each of the following statements as true or false. Provide an explanation to justify each of your answers.
The data provide statistically significant evidence that more than half of U.S. adult Twitter users get some news through Twitter. Use a significance level of \(\alpha = 0.01\text{.}\)
Since the standard error is 2.4%, we can conclude that 97.6% of all U.S. adult Twitter users were included in the study.
If we want to reduce the standard error of the estimate, we should collect less data.
If we construct a 90% confidence interval for the percentage of U.S. adults Twitter users who get some news through Twitter, this confidence interval will be wider than a corresponding 99% confidence interval.
5. Waiting at an ER, Part I.
A hospital administrator hoping to improve wait times decides to estimate the average emergency room waiting time at her hospital. She collects a simple random sample of 64 patients and determines the time (in minutes) between when they checked in to the ER until they were first seen by a doctor. A 95% confidence interval based on this sample is (128 minutes, 147 minutes), which is based on the normal model for the mean. Determine whether the following statements are true or false, and explain your reasoning.
We are 95% confident that the average waiting time of these 64 emergency room patients is between 128 and 147 minutes.
We are 95% confident that the average waiting time of all patients at this hospital's emergency room is between 128 and 147 minutes.
95% of random samples have a sample mean between 128 and 147 minutes.
A 99% confidence interval would be narrower than the 95% confidence interval since we need to be more sure of our estimate.
The margin of error is 9.5 and the sample mean is 137.5.
In order to decrease the margin of error of a 95% confidence interval to half of what it is now, we would need to double the sample size.
(a) False. Inference is made on the population parameter, not the point estimate. The point estimate is always in the confidence interval.
(b) True.
(c) False. The confidence interval is not about a sample mean.
(d) False. To be more confident that we capture the parameter, we need a wider interval. Think about needing a bigger net to be more sure of catching a fish in a murky lake.
(e) True. Optional explanation: This is true since the normal model was used to model the sample mean. The margin of error is half the width of the interval, and the sample mean is the midpoint of the interval.
(f) False. In the calculation of the standard error, we divide the standard deviation by the square root of the sample size. To cut the SE (or margin of error) in half, we would need to sample \(2^2 = 4\) times the number of people in the initial sample.
6. Mental health.
The General Social Survey asked the question: ``For how many days during the past 30 days was your mental health, which includes stress, depression, and problems with emotions, not good?" Based on responses from 1,151 US residents, the survey reported a 95% confidence interval of 3.40 to 4.24 days in 2010.
Interpret this interval in context of the data.
What does “95% confident” mean? Explain in the context of the application.
Suppose the researchers think a 99% confidence level would be more appropriate for this interval. Will this new interval be smaller or wider than the 95% confidence interval?
If a new survey were to be done with 500 Americans, do you think the standard error of the estimate be larger, smaller, or about the same.