|


| |
|
Due Date:
Sent to mailing list / announced in class |
150 Points |
CIS 120 Walter
Morales Assignment # 3
Date due:
Sent to mailing list /
announced in class
Objective:
To create a
group spreadsheet and graphs with expenses and totals for the whole year
of 2003.
The
intent of this assignment is for the student, in a group, to create an
expense/income spreadsheet containing expenses of various kinds and income for
2003.
In the
group assignment you will need to have 30 items/expenses (subcategories),
per student, so, you can expect a large spreadsheet. It will be a good
challenge printing it in a presentable manner!
A nice
looking product will be expected since this is a group assignment. Please,
remember to use the proper formatting, remember to put $ signs by the numbers,
and the most important “ask questions about this assignment constantly”,
via e-mail, phone or in class if you find yourself “stuck.” There may be various
questions that will arise during the planning stages. We will work on this
assignment in phases and you will have the opportunity to meet with your group
in class, if time permits, but there will be some meetings that you will have to plan outside of
the classroom.
Since this is a group work
the participation of ALL the members will be very important. The group leaders
that are assigned will report to the instructor with the progress of the project
and if any problems arise. Also, it is their responsibility to distribute the
work among the group members and keep a schedule to make sure the work is
finished on time.
NOTE: Those members indicated by the group that are not
actively and responsibly taking part of the project will be asked to create the
assignment separate from the group. Remember that all members will have to
participate equally!
Caution:
DO NOT repeat the values in more than 7 expenses during the year. For
instance: rent, car payment, insurance are expenses that repeat every month,
so, that is OK, you can have only up to 7 repetitions per student. This is
important since your graphs will depend on this data.
Turn in:
1.
Cover sheet with a logo for the group, and your names. This should be
created using MS Word that you learned in class. It should include a picture or
you can also use the Word Art as demonstrated in class.
2. A
table of contents with numbers (make sure to put numbers in your pages).
You do not need a page number on the cover page or the table of contents.
3. One or two paragraph statement, per student, with their names and what
was their responsibility in this project.
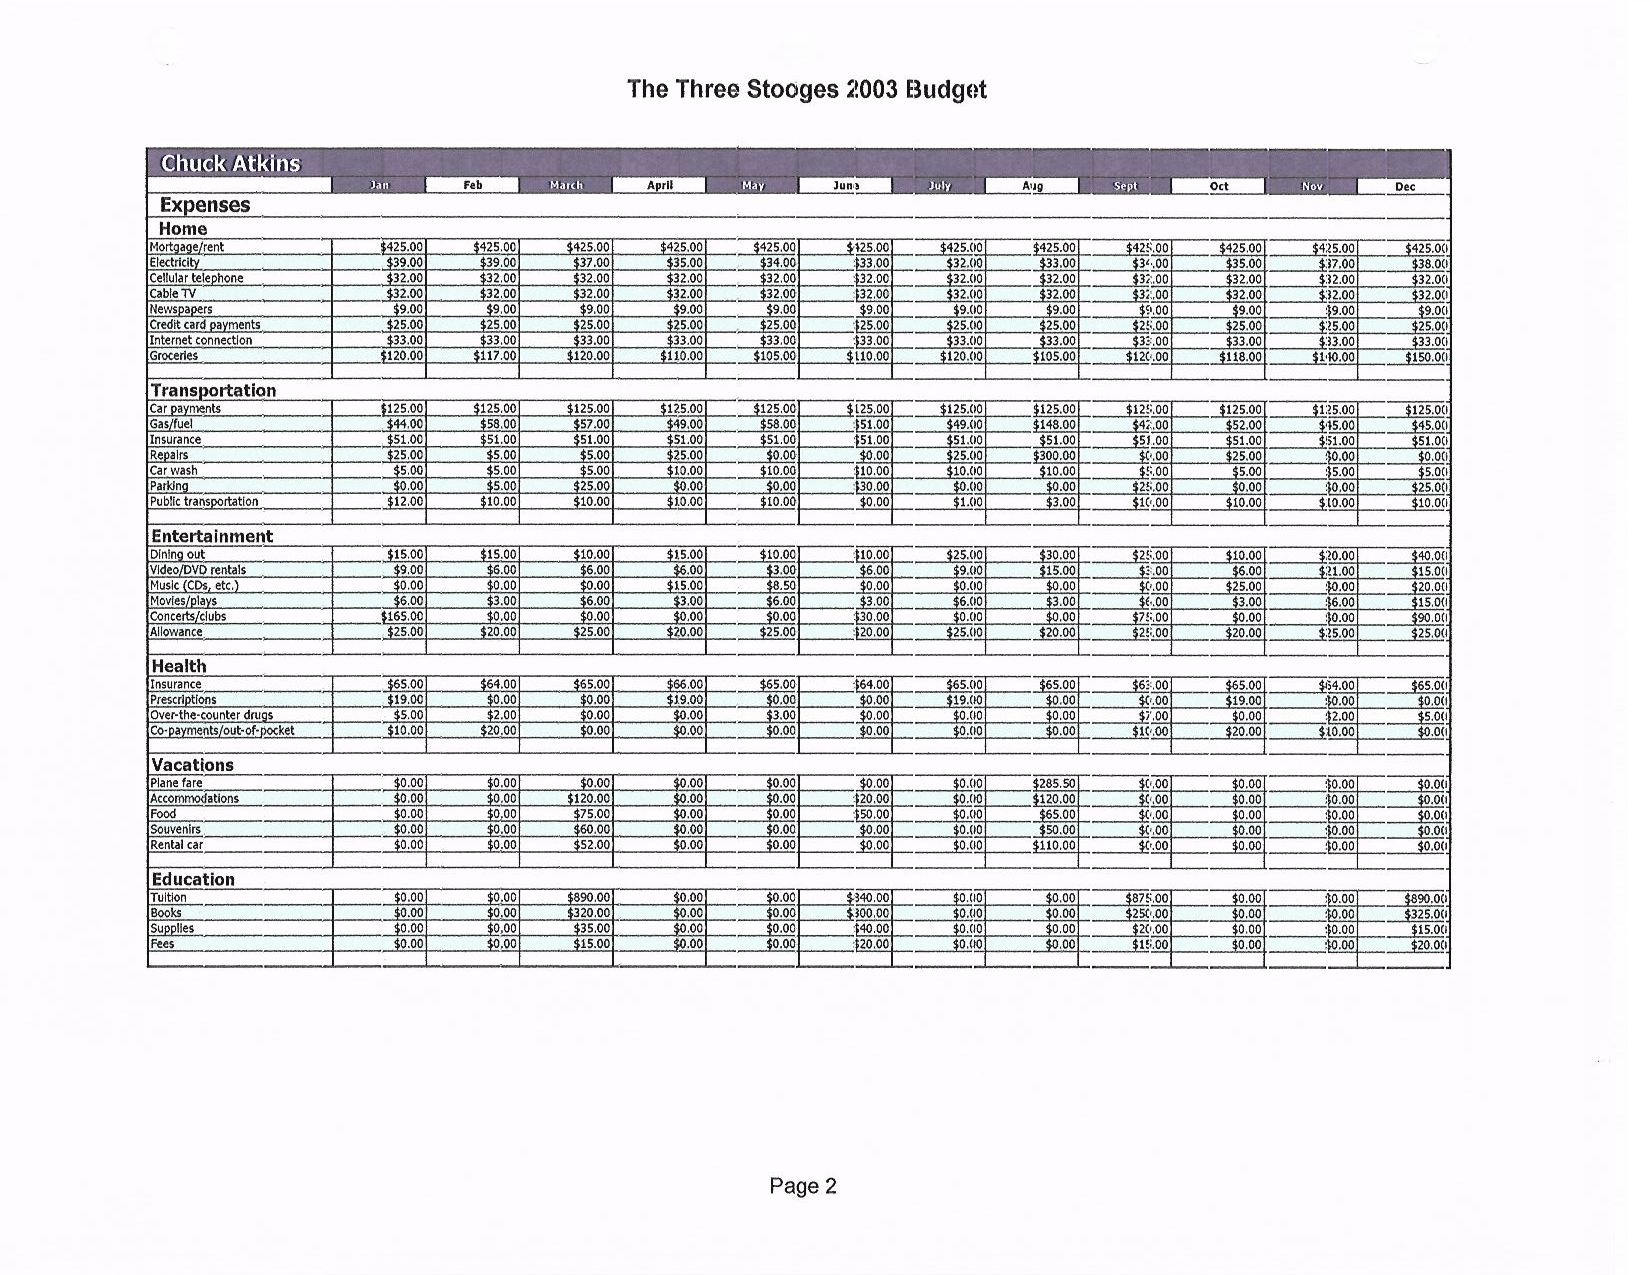
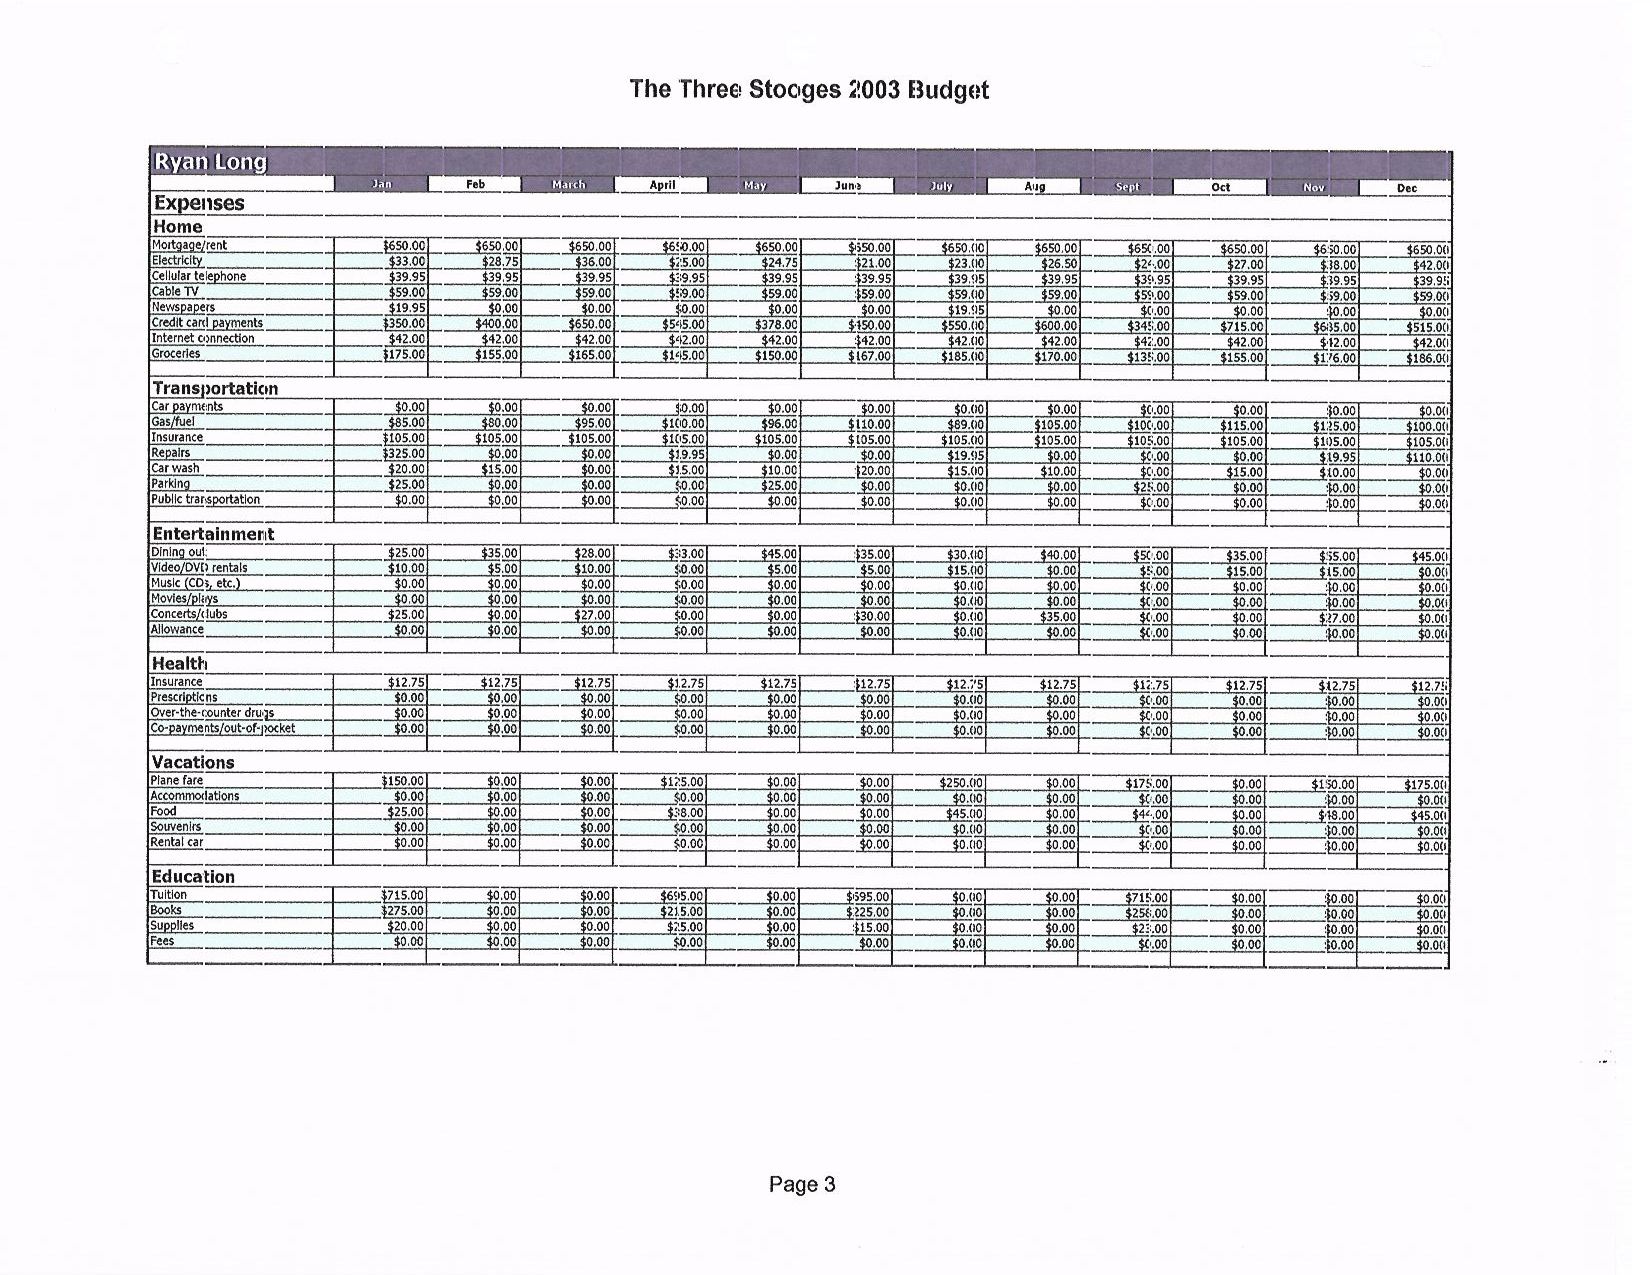
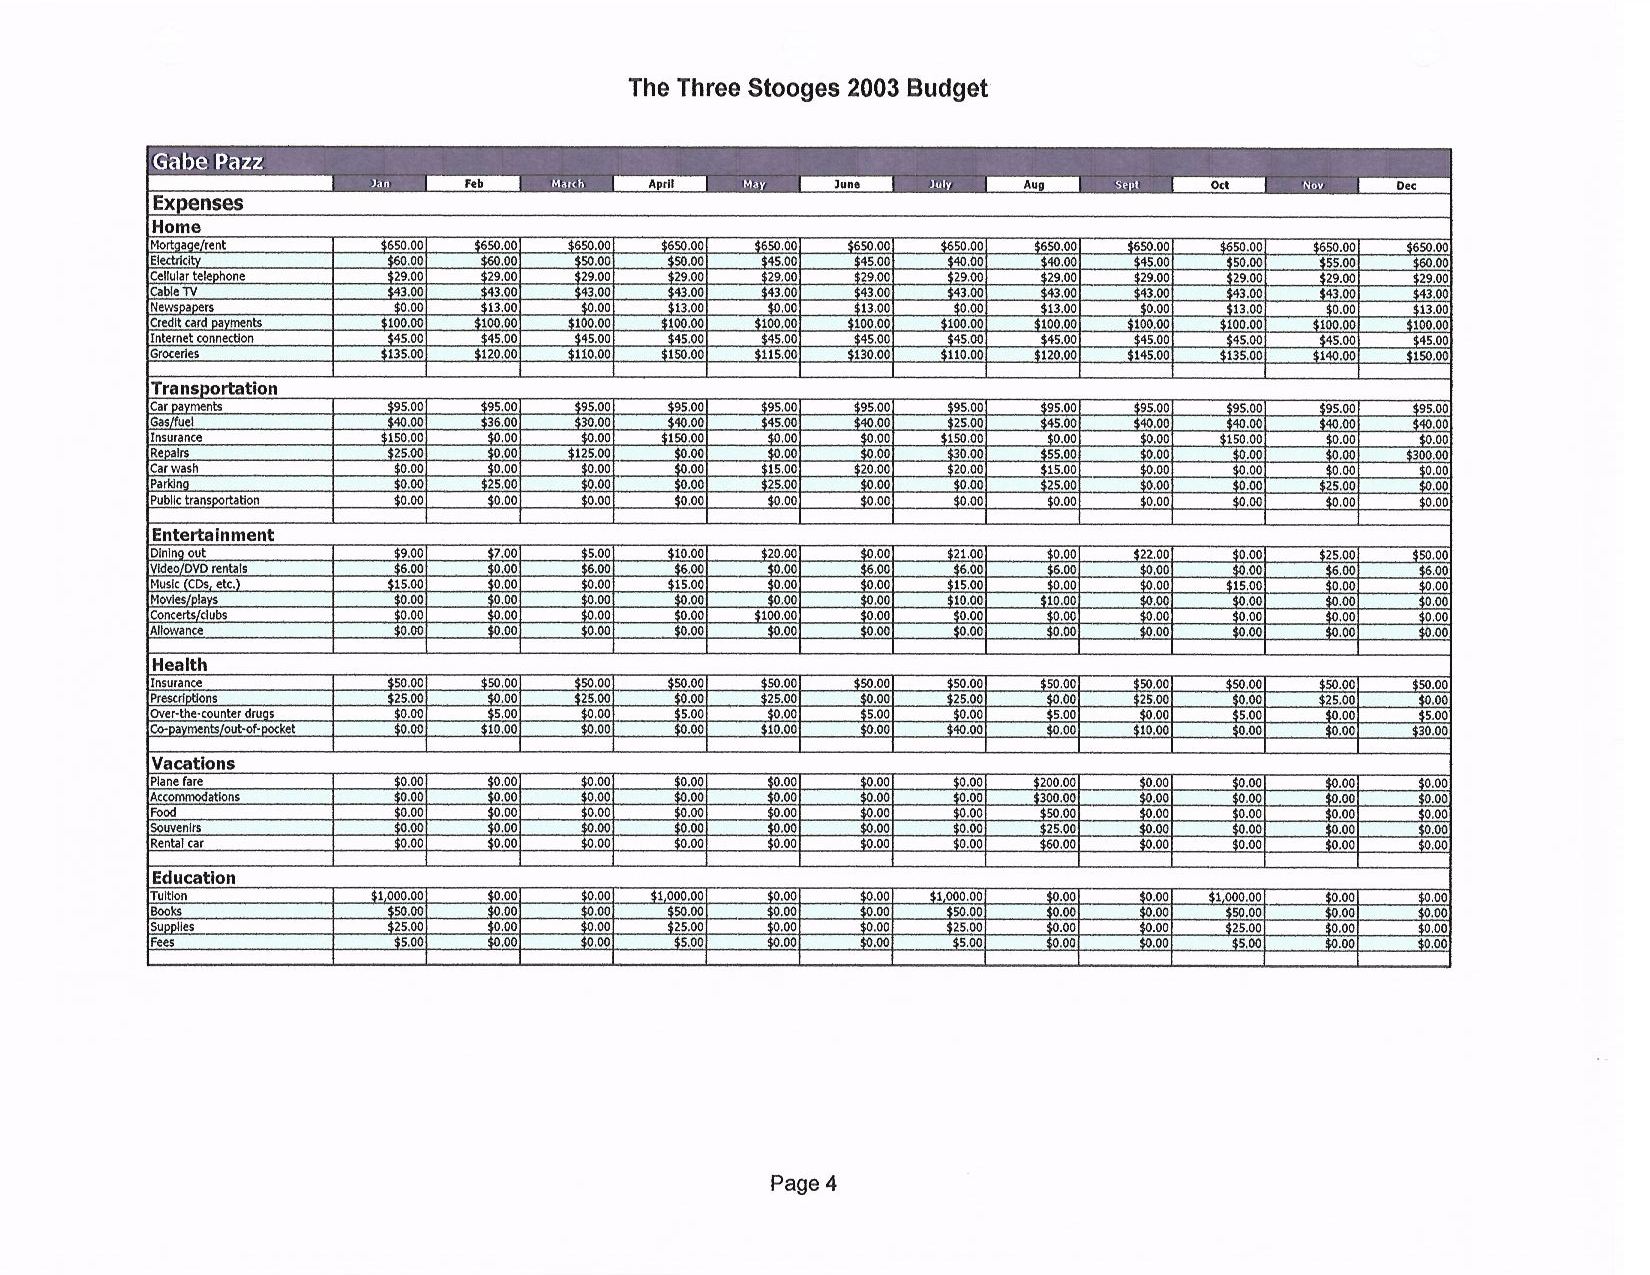
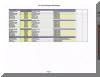
4. A hard copy of the full spreadsheet in a presentable manner. Do not print
it too small or too big. Using laser printers you may fit one and half or two
people per page.
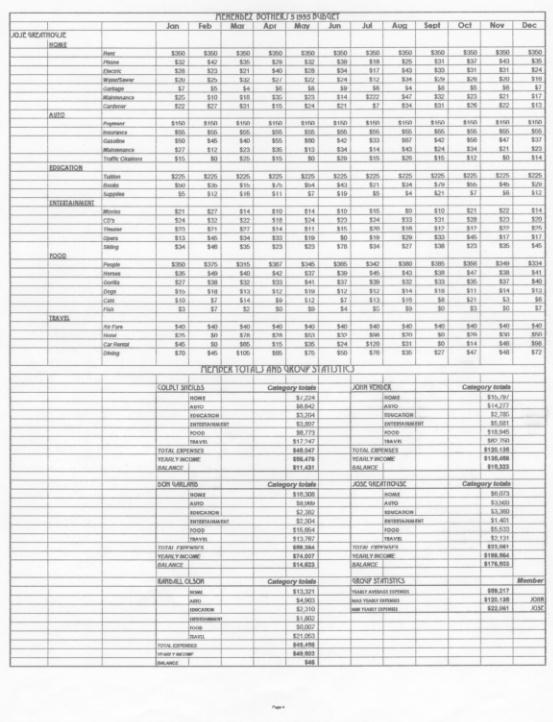
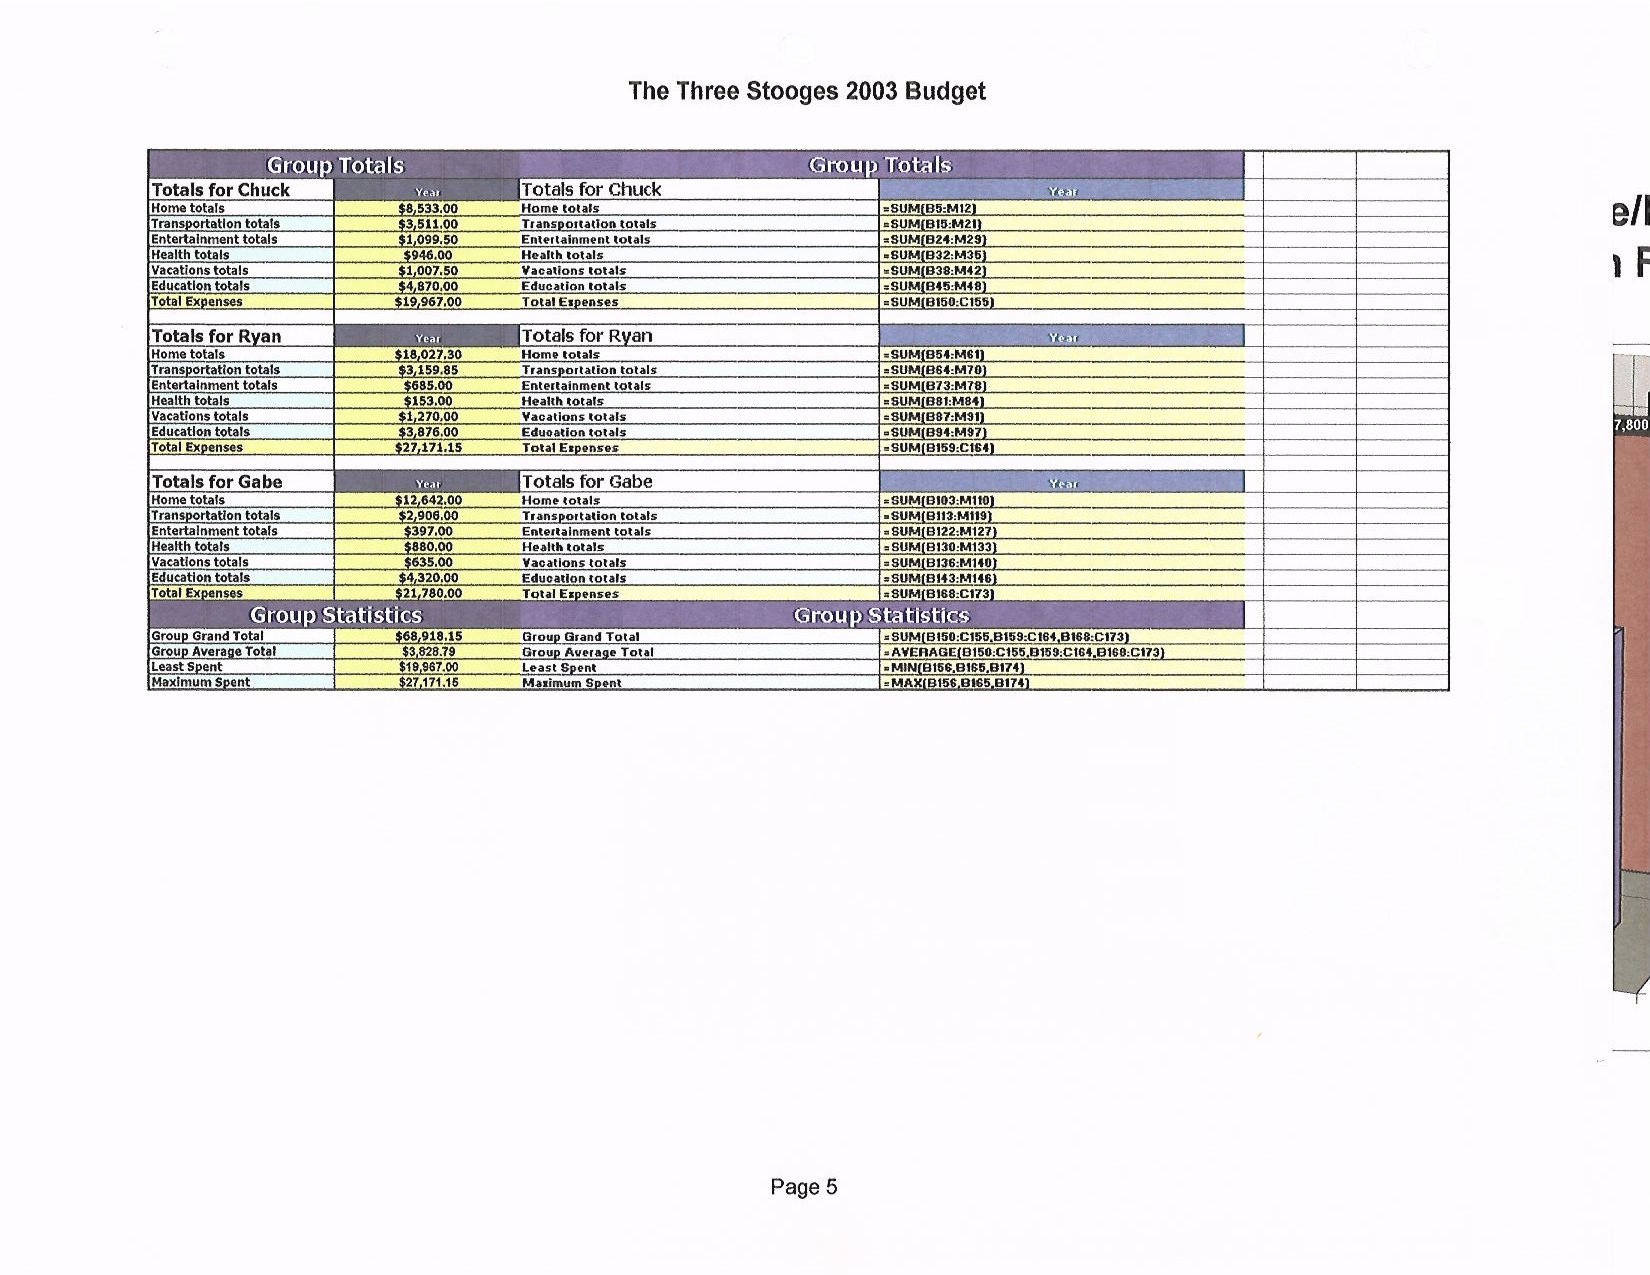
5. A print out of the formulas used in your spreadsheet (only the bottom
part where you have the calculations, not the whole spreadsheet) NOTE: DO NOT
put totals for each individual student. You should have a summary at the end
with all the categories totals, a grand total for all the expenses for the
group. An average of all the expenses for the group, a MIN formula which will
indicate who spent the least and a MAX formula indicating who was the biggest
spender.
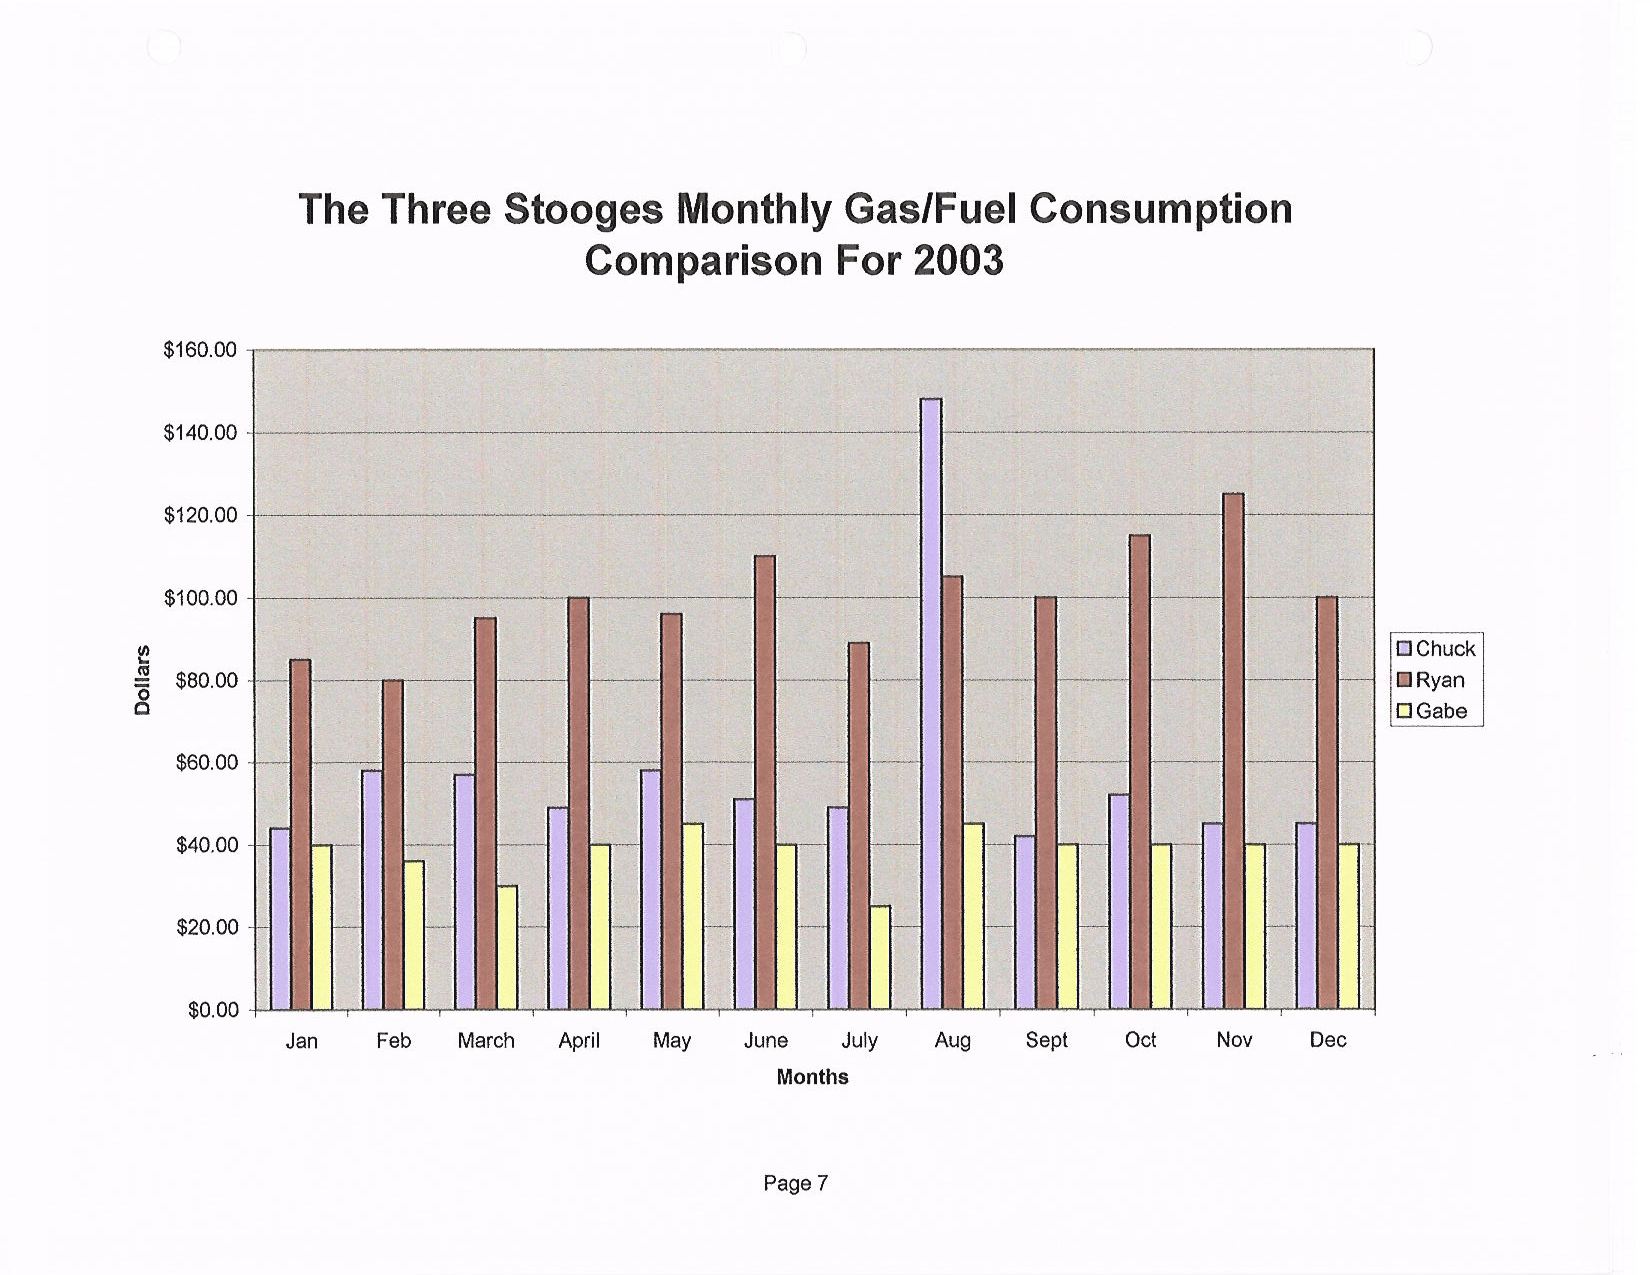
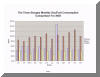
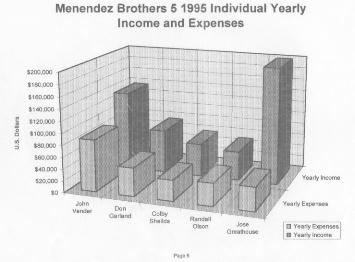
6. Create 5 graphs containing different types of statistical information,
and they should also be of different types. i.e. pie, bar, line, etc. The graphs
need to be complete with proper labeling. Each person in the group is supposed
to create 2-3 graphs and the group will decide which ones will be included in the
final project. This will give a chance for all the members to work on the graphs.
Show your work to the instructor before handing in the project, this will
guarantee your group a good grade!
There are
four criteria in which the group will be graded:
Organization, Presentation, graphs, spreadsheet.
Look at the sample pages from a previous assignment,
this was worth 150 points. Very complete with all the requirements.
Turn in:
Click on the images to enlarge them
|
 |
Cover sheet with a logo for the group, and
your names. This should be created using MS Word that you learned in
class. It should include a picture or you shoul also use the Word Art as
demonstrated in class. |
| A list of contents with numbers (make sure
to put numbers in your pages). You do not need a page number on the cover
page or the table of contents. |
 |
|
 |
One or two paragraph statement, per
student, with their names and what was their responsibility in this
project. |
| A print out of the formulas used in your spreadsheet
(only the bottom part where you have the calculations, not the whole
spreadsheet) |
|
 |
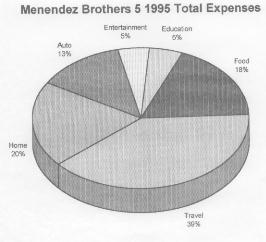
| Create 5 graphs containing different
types of statistical information, and they should also be of different
types. i.e. pie, bar, line, etc. The graphs need to be complete with
proper labeling. Each person in the group is supposed to create 3 graphs
and the group will decide which ones will be included in the final
project. This will give a chance to all the members to work on the
graphs. Show your work to the instructor before handing in the
project, this will guarantee you a good grade! |
|
| Some great samples: |
 |
MAKE SURE TO CHECK EACH ITEM TO
RECEIVE FULL POINTS!!!
Grading Criteria for group assignment
Assignment number seven is worth
150 points. The scoring of this assignment is divided as follows. Make sure that
you fulfill each requirement to earn full points. So, use this form as a check
list. The best way to guarantee a good grade is to show the final project to
your instructor prior to hand it in. Your instructor will suggest changes and
improvements.
Presentation (37.5
points)
- ________ Is cover page well
centered, space well used, clean ?
-
________ Was
the whole project printed with the same printer so that all pages have the
same appearance ? (sometimes when you print using different dot matrix
printers some pages are lighter than others.
- ________ Spelling correct
on spreadsheet and the rest of the project?
- ________ Do the spreadsheet
take too many pages? (make sure to condense the print of the whole
spreadsheet so that it does not take too many pages)
- ________ Is the printed
size of the spreadsheet legible?
- ________ Are the fonts used
in the whole project consistent?
- ________ Are all the pages
on the graphs or spreadsheets printed in the same direction? (all portrait
or landscape).
- ________ Do the graphs use
the space on the paper well. (graph too small for the page size, small fonts
used)
Organization (37.5
points)
Are all parts of the
assignment enclosed?
-
- ________cover with name of
the members and a graph
- ________table of contents
- ________1 or 2 paragraph
statement per group member on what were their responsibilities.
- ________the spreadsheet
- ________the spreadsheet
formulas
- ________graphs
- ________Does the table of
contents match page numbers?
- ________Are all pages
somehow binded ? (Please do not use the plastic cover with the plastic
sliding lock)
Spreadsheet (37.5 points)
- ________Does it have all
the 30 sub-categories per student?
- ________Do you have a lot
of 0's in your expenses? (this will affect your graphs, make sure that you
do not have too many of them, better yet none. Just make up some numbers)
- ________Did you avoid
repeating the values in the expenses more than 7 sub-categories? (each extra
sub-category where the values are repeated will count -2 points each!)
- ________Does the
spreadsheet meet the requirements of the assignment? (all individual
spreadsheets combined into 1 and the calculations at the end?)
- ________Are the
calculations correct?
- ________Do you have dollar
signs?
- ________Did you include the
printed formulas sheet at the end?
- ________Did you put page
numbers?
Graphs (37.5 points)
- ________Is the data
represented on the graph appropriate? (i.e. when comparing data, DO NOT use
January X February as a comparison, instead, use quarters. Do not compare
data such as Phone X Gas, but you may want to compare all sub-categories
under home, or you may want to compare all the categories)
- ________Do the graphs
represent comparisons between all the members of the group? (not individual
graphs. i.e. John Doe 1994 electric expenses, instead use Marie, John, Bob,
Marcia (Group X)
- ________Is the proper graph
type used for the type of information portrayed? such as line graphs for
trends, bar for comparisons, etc.
- ________Are the labels used
correctly? Graph title, x-axis, y-axis, legends?
- ________Does the graph name
represent the graph properly? (i.e. if you labeled a graph "Income vs.
Expenses" and you have the graph displaying income, expenses and balance)
- ________Did you put the
year on the graph title?
- ________Group name on the
graph? (i.e. 1994 Group Z Expenses vs. Income.)
- ________Is the graph
displayed hindering information. (such as 3-D bar graphs tend to hide
information, make sure to avoid that type of graph. Line graphs tend to
overlap each other if the values are close to each other. Using a black and
white dot matrix printer if the values are too close one line will cover
each other. It will be better to use a color or laser printer.
- ________Dollar signs on
values in the graphs?
- ________If you use pie
graphs make sure that you don't single out a piece of the pie unless that is
the intent of the graph and it is properly labeled.
- ________Did you make sure
that you did not repeat the graph? For instance. You have a bar chart
comparing income and expense and the other graph compares the same
information but it is a pie chart.
- ________Page numbers on all
pages.
Check some of those links for Excel basics:
If you have any questions about this assignment
be sure to let the instructor know before it is due, if you can not meet me
during regular lab hours be sure to call me 503-6147604 or leave me an e-mail
message wmorales@pcc.edu
|