Section 9 Graphics in Exercises
It is natural to want to write exercises that rely on graphics. For example, an exericse might produce a chart of some kind, and ask the reader to extract some information from that chart.
If your WeBWorK server is version 2.16 or later, WeBWorK problems can process tikz code. Here is an example.
Checkpoint 9.1. Solve using a tikz graph.
This image is a visual proof that \(\sum_{k=1}^{n}k\) equals what?

\(\frac{n\!\left(n+1\right)}{2}\)
At present, this can be done using the same mechanism one would use to insert a graphic into a WeBWorK problem when writing regular WeBWorK problems. (And this is what is done below.) In the future, there will be a nicer option that will be able to make use of PTX's latex-image-code. This requires some WeBWorK development first, which is underway.
Checkpoint 9.2. Solve using a graph.
The graph below is a graph of \(y=f(x)\text{.}\) Use the graph to solve the equation \(f(x)=1\text{.}\)
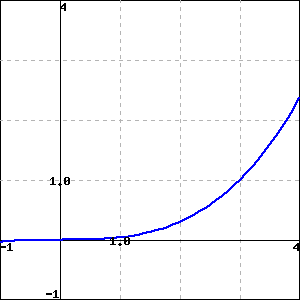
\(x=\)
\(3\)