Ó 2001
Prentice Hall
6.14


Spreadsheet Graphics:
From Digits to Drawings
From Digits to Drawings
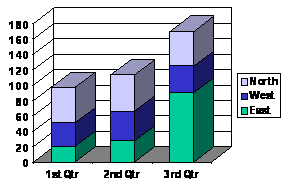
–Bar charts (use if data falls into a
few categories)

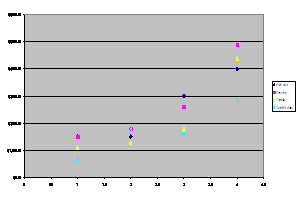
–Scatter
charts (use to discover, rather than to display, a relationship between two variables)
