|
1
|
|
|
2
|
|
|
3
|
- Addresses (column letter and row number, e.g., A1, C12)
|
|
4
|
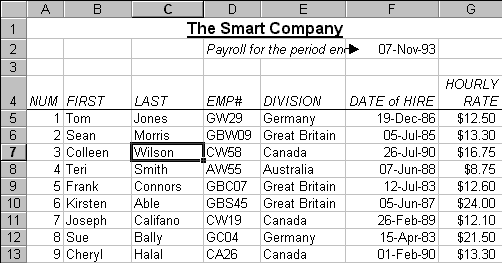
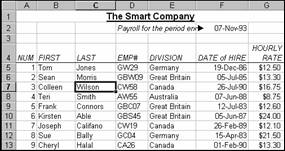
- Values such as numbers and dates
|
|
5
|
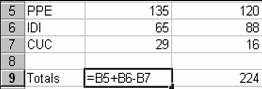
- Formulas allow you to create instructions using mathematical expressions
and commands
|
|
6
|
|
|
7
|
- Formulas can be relative, so they refer to different cells when they are
copied
- Or absolute, so the formula references never change when they are copied
|
|
8
|
|
|
9
|
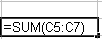
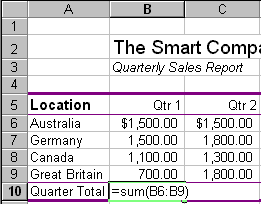
- Functions (e.g., SUM, AVG, SQRT) are used to automate complex
calculations
- Macros let you store keystrokes and commands so they can be played back
automatically
- Templates offer ready-to-use worksheets with labels and formulas already
entered
|
|
10
|
- Linking spreadsheets together
|
|
11
|
- Search for information
- Sort the data by a specific criteria
- Merge the data with a word processor
- Generate reports
|
|
12
|
- Spreadsheets allow you to change numbers and instantly see the effects
of those changes.
- “What if I enter this value?”
|
|
13
|
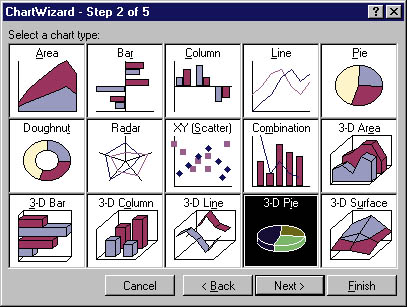
- Charts allow you to turn numbers into visual data:
|
|
14
|
- Bar charts (use if data falls into a few categories)
|
|
15
|
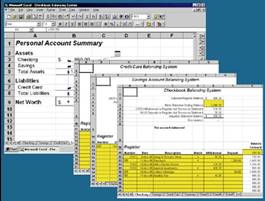
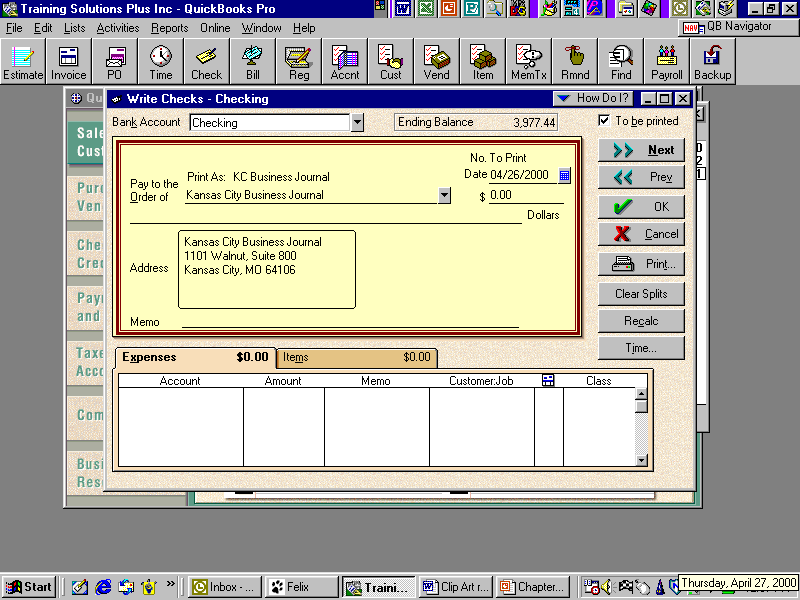
- Accounting and Financial Management software allows you to do
electronically handle routine transactions
such as:
- writing checks
- balancing accounts
- creating budgets
|
|
16
|
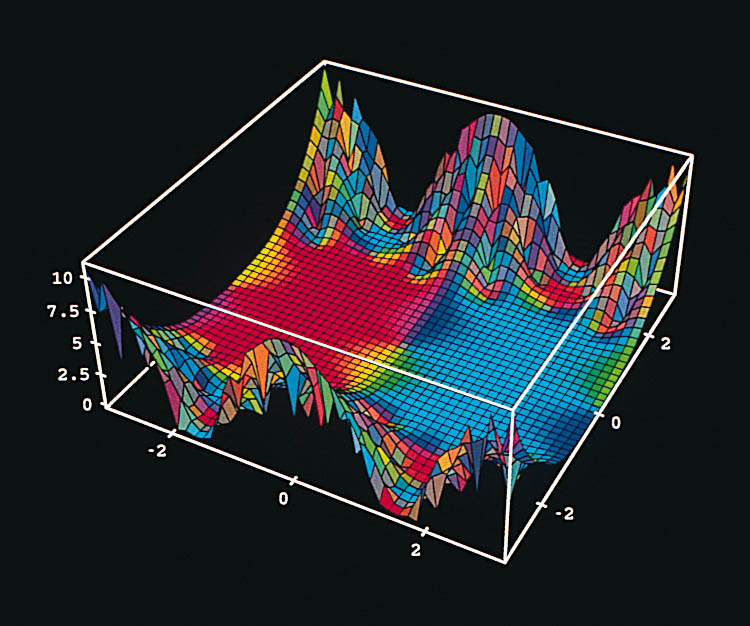
- Mathematics Processing software turns abstract mathematical
relationships into visual objects.
|
|
17
|
- Statistical and data analysis software collects and analyzes data that
tests the strength of data relationships.
|
|
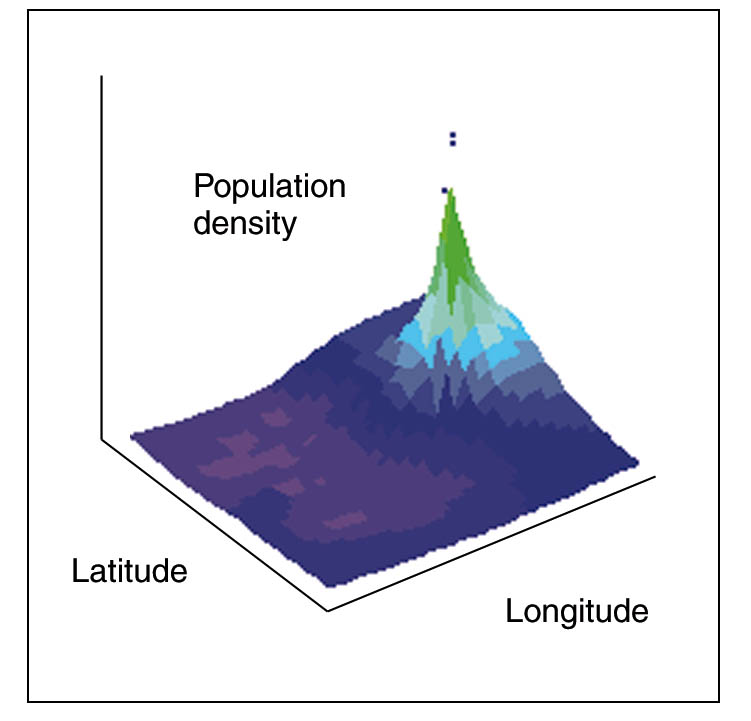
18
|
- Scientific visualization software uses shape, location in space, color,
brightness, and motion to help us visualize data.
|
|
19
|
- Computer modeling uses computers
to create abstract models of objects, organisms, organizations, and
processes
|
|
20
|
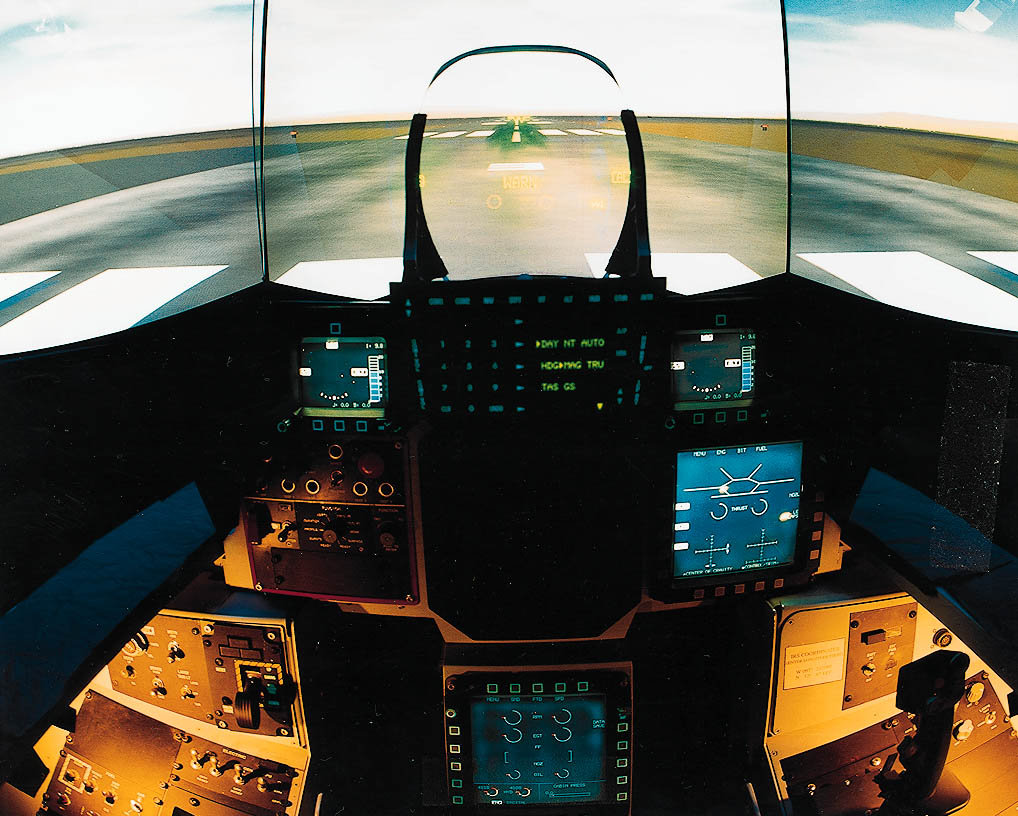
- Examples:
- computer games (chess boards, sports arenas, and mythological
societies)
- computer models of organisms, objects, and organizations
- flight simulators and
simulations of science lab activities
- managing a business, city, or nation
|
|
21
|
- Computer Simulations are widely used for research in the physical,
biological, and social sciences, and in engineering.
|
|
22
|
- Schools, businesses, and the military use simulations for training
because:
- Safety: non-threatening environments
- Economy: less expensive than real life
- Projection: less threatening to systems
- Visualization: allows to see and understand
- Replication: allows repetition of projects
|
|
23
|
- Risks:
- Simulation isn’t reality.
- Not all factors can be entered into the model or simulation.
|
|
24
|
|

 Notes
Notes