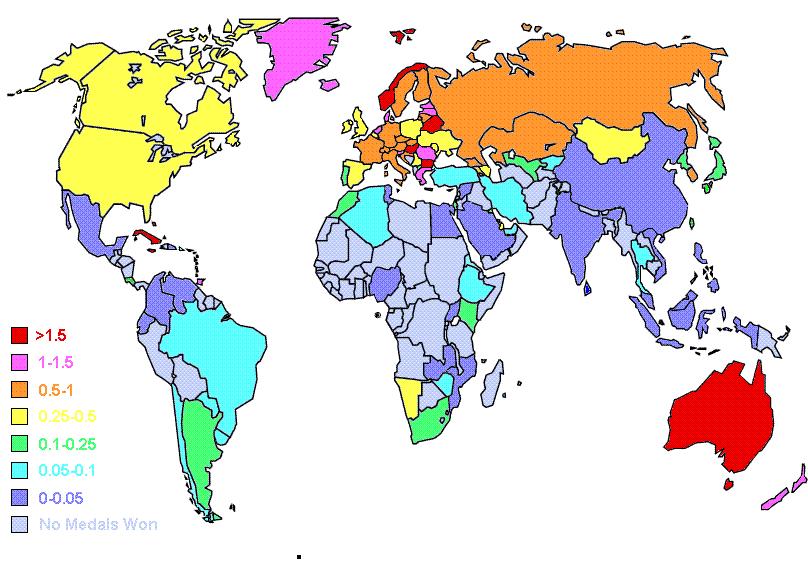
Fig. 3. Olympic Medals Per Million Inhabitants
This map illustrates the average number of medals won per million people in an Olympic Summer Games between 1996 and 2004. These medal counts were used primarily due to the fact that participating nations have remained relatively unchanged during this time period. (Prior to 1996, the former Soviet Union teams participated as one team.)
Prevalance of Child Marriage by Country:
Percentage of women aged 20–24 who were married or in union before
age 18 (1987–2006)
45 PER CENT OF WOMEN AGED 20–24 IN SOUTH ASIA, 40 PER CENT IN
SUB-SAHARAN AFRICA, WERE MARRIED AS CHILDREN
Percentage of women aged 20–24 who were married or in union before age
18, by region (1987–2006)
Fig. 1. USDA Food Pyramid, 2002.
Alcohol Consumption per Capita:
(Fig. 2) This map illustrates the average number of litres of alcohol consumed per capita based on data from 2003. The figures for individual states were taken from the National Institute on Alcohol Abuse and Alcoholism (NIAAA) and the figures for the other countries were taken from the Organization for Economic Co-operation and Development (OECD).