Math Graphs
Example: Quadratic Function
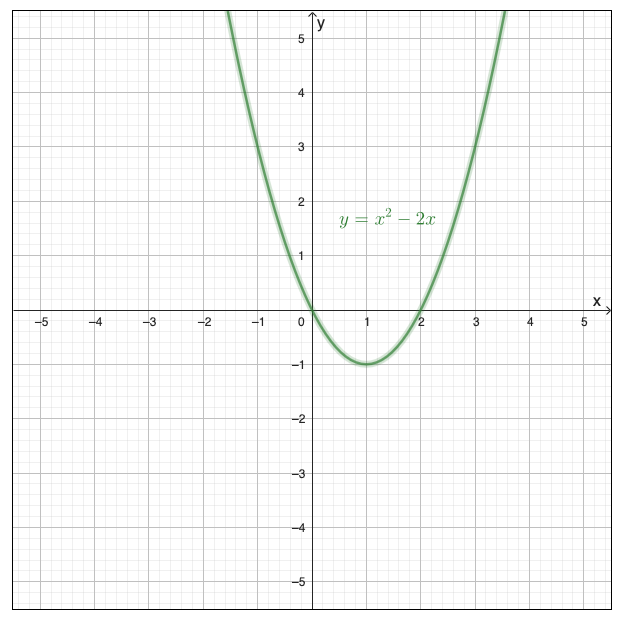
The graph below shows the parabola for \( y = x^2 - 2x \).
Guidelines for Describing Math Graphs
State the type of graph, function or equation
State the equation if give, or describe the graph of function
Describe the axes and labels
Describe the scale and axes and any text in the image as they relate to the function
Identify key features
Vertex, intercepts, asymptotes, maxima, minima, or the important information about where the function “leaves the page”
List coordinate points
Provide specific (x, y) values, especially for key features.
Organize the description
Move from left to right, top to bottom. Make two passes if necessary for coordinate system and function.
Alternative Format Options
Description with coordinate list provides both shape and data.
This graph shows a parabola representing the quadratic function \(y = x^2 - 2x\). The parabola opens upward with its vertex (minimum point) at (1, -1). The curve crosses the x-axis at two points: x = 0 and x = 2.
Key points:
- x = -2, y = 8
- x = -1, y = 3
- x = 0, y = 0 (x-intercept)
- x = 1, y = -1 (vertex)
- x = 2, y = 0 (x-intercept)
- x = 3, y = 3
Data tables allow students to plot or analyze the function.
| x | y = x² - 2x |
|---|---|
| -2 | 8 |
| -1 | 3 |
| 0 | 0 (x-intercept) |
| 1 | -1 (vertex) |
| 2 | 0 (x-intercept) |
| 3 | 3 |
Sonification converts mathematical data to audio, allowing students to “hear” the shape of a graph through changes in pitch.
As x increases from left to right, the pitch:
- Starts high (y = 8 at x = -2)
- Descends to the lowest point (y = -1 at x = 1, the vertex)
- Rises again (y = 3 at x = 3)
Resources for creating sonifications:
Where to Place the Description
Give the description a heading and reference it in the alt text, or otherwise make sure the relationship between the description and image is clear. If the description is placed at the end of the document use #heading reference links to move back and forth.